
by Adrian Worton
Introduction
In our last article we introduced the TGIAF General Election 2015 simulator, an interactive version of which is available here.
Today we will look at the results from 1000 simulations of our model, an approach we took with our World Cup simulator. By doing so many simulations, the results will be very close to the "true" probabilities within our model, and we can therefore make reasonably confident predictions.
We will run through the results party-by-party, in increasing numbers of expected seats.
Independents
Independents
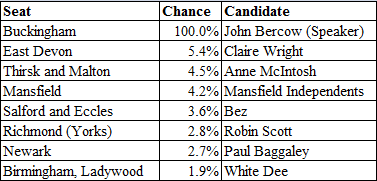
In our model "Independents" are listed as one party, however by definition they are a series of unrelated candidates. On the right is a table of each constituency with an independent candidate (within the model), along with their chance of winning the seat.
As there are no other candidates with odds given in the Buckingham constituency, John Bercow has been given a 100% chance of success in our model.
Minor parties
As there are no other candidates with odds given in the Buckingham constituency, John Bercow has been given a 100% chance of success in our model.
Minor parties
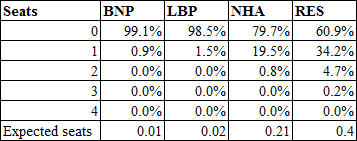
Four parties in our model - the British National Party (BNP), the Liberal Party (LBP), the National Health Action Party (NHA) and Respect (RES) - are only standing in a few constituencies, so on the right we have listed their chances of getting 0, 1, 2, 3 and 4 seats. For an explanation of "Expected seats", see the appropriate section below.
Green Party
Green Party
The Green Party has seen a massive increase in membership numbers during 2014, with numbers doubling between January and December. This has been attributed to a number of factors, from their being the only major national party to openly support Scottish independence to the publicity generated by the decisions by television stations to exclude the party’s leader Natalie Bennett in their leaders’ debates.
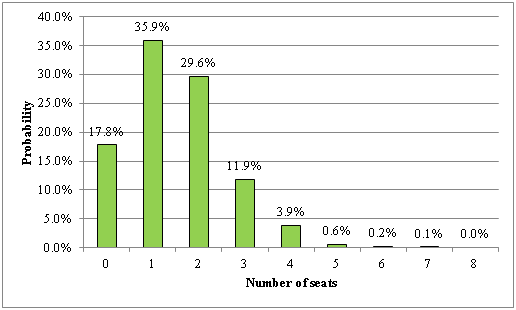
The good news for the party is that they have a 82.2% chance of at least maintaining their current position of one MP, and a 46.3% chance of improving upon it. However, as the party has been occasionally polling ahead of the Liberal Democrats in opinion surveys, it is an indictment of the UK's voting system that the Greens will see such a low number of MPs. On the crowd-funded Vote for Policies website, visitors have to pick their preferred policies, without knowing which party they come from. On this site, the Green party have a clear lead over all six major national parties, so their low profile nationally could be considered a success story for a media industry which doesn't want to encourage progressive politics.
Plaid Cymru
Following poor results in the 2011 Welsh National Assembly elections, where the party slipped from second to third place, Leanne Wood was chosen to lead the party, its first female leader. The focus of the party may be more on the 2016 National Assembly votes, as they will look to follow the lead of the SNP in making independence a topic of national conversation.
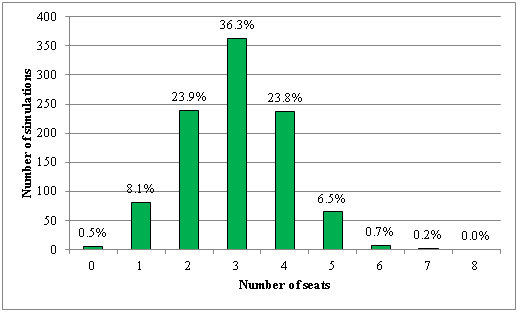
Plaid currently have three seats, and the model predicts that this is the party’s most likely result from the upcoming election, at 36.3%. Perhaps as an indicator of how Plaid’s standing has largely remained the same since 2010, they have an almost equal chance of losing seats (32.5%) as gaining (31.2%).
Scottish National Party
It has been a big year for the SNP, with the referendum they have long campaigned for happening in September this year. The party was unsuccessful with the vote, and this might have been a sign that they might struggle in the upcoming general election. However, the effect has been emphatically the opposite. Despite losing the vote, the SNP came out appearing a more honest option than the national parties, who are failing to follow through with their promises for increased Scottish powers.
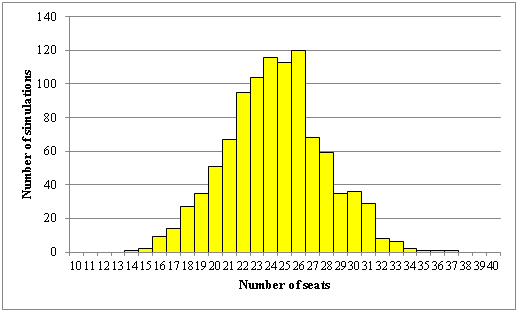
The extent to which the SNP are expected to thrive next year is shown by the fact that every simulation shows the party improving on their current 5 seats, with a 82.8% probability of having MPs numbering in the 20s.
United Kingdom Independence Party
The extent to which the SNP are expected to thrive next year is shown by the fact that every simulation shows the party improving on their current 5 seats, with a 82.8% probability of having MPs numbering in the 20s.
United Kingdom Independence Party
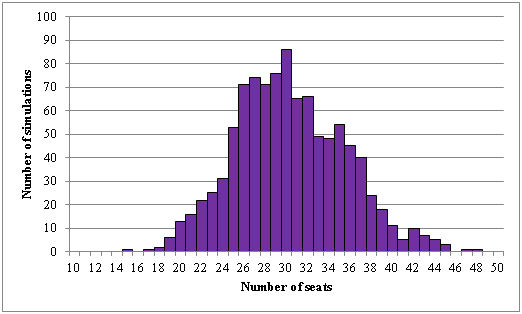
If the SNP’s expected gain next spring is impressive, it is somewhat overshadowed by the expected gain for the manifesto-less UKIP, who currently have two seats (both from by-elections caused by defecting Conservative MPs). This is undoubtedly brought about by their high profile in the last few years, caused by a plethora of controversial statements by MPs, and a fawning national media.
After UKIP polled the highest of any UK party in the 2014 European elections, it is perhaps to be anticipated that they will follow it up with large gains in the general election, with a 53.8% chance of at least 30 MPs, and a 99.0% chance of at least 20. This very strong performance within the model is due to UKIP being the party which is represented in the joint-most constituencies, 500, the same as the Conservatives, with Labour being represented in 492 (a reminder: in each constituency only parties with odds under 100/1 are considered).
Liberal Democrat Party
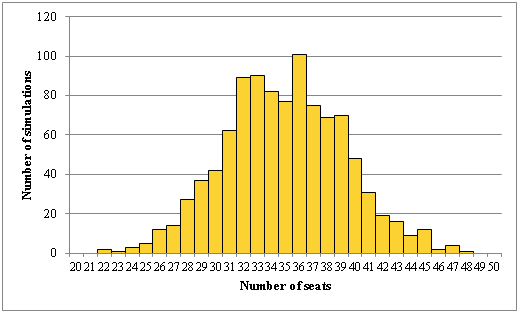
It seems a very long time ago that the Liberal Democrats entered the 2010 general election on a wave of optimism, after impressive debate performances from Nick Clegg. The party actually lost seats in that vote, but they still got 57, allowing them to form a coalition government with the Conservatives. Since then, it has been a disaster for the party, with their low resistance to a series of government policies which were in direct contradiction to the Lib Dem’s 2010 manifesto seeing their voters desert them in droves.
With all this in mind, the party will probably see a victory over UKIP in the battle for third place as a major victory, and this is what the model leans towards, with 71.9% of simulations ending with the Lib Dems having more seats (and 5.0% ending with a tie between the two parties). This may be seen as a bit of a shock, with UKIP consistently polling higher than the Lib Dems (YouGov have had UKIP poll higher than the Lib Dems in every poll since April 2013). However, we earlier mentioned that UKIP are represented in a large amount of constituencies, it could be that their supporter base is spread a lot thinner than other parties. The Lib Dems are also benefitting from their current seats, where disapproval with individual MPs is less than disapproval with the party as a whole. If this is the case, than it may be somewhat of an irony that the referendum decision to reject the Lib Dem’s proposal for an alternative vote system may preserve their position as the third-biggest party in the UK.
Conservative Party
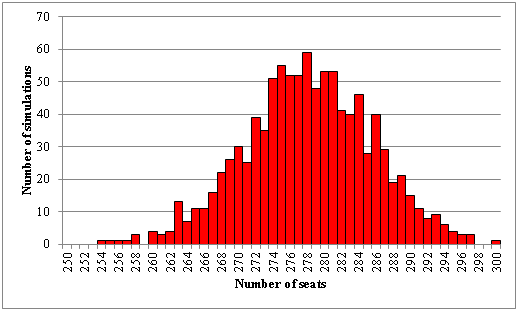
It is perhaps not unfair to say that the Conservatives will have had mixed feelings following the 2010 general election, as they beat Labour by 306 to 258 seats. However, they failed to get the majority many had predicted, and had to enter into a coalition government with the Liberal Democrats. Since then it could certainly be argued that the overall effect has been barely distinguishable from a Conservative majority.
With the party currently holding 303 seats, the distribution above clearly shows that the party will see some kind of loss in the spring, with a 28.3% chance of that loss being at least 50 seats.
Labour Party
With the party currently holding 303 seats, the distribution above clearly shows that the party will see some kind of loss in the spring, with a 28.3% chance of that loss being at least 50 seats.
Labour Party
Since the arrival of Ed Miliband as party leader following the disastrous 2010 general election campaign, the party has continued to struggle to convince the electorate that they are a viable alternative to the Conservatives, with the Labour leader’s public image being cited as a key reason voters haven’t flocked to the party.
However, despite these struggles, our model predicts Labour to see an increase on their current tally of 254 MPs, with 74.7% of simulations seeing Labour make a gain of at least 30 seats. It is clear that Labour are roughly predicted to finish with more seats than the Conservatives within our model, but of course, the two results aren’t independent. Therefore, we need to look at the combined results for these two parties.
Conservatives versus Labour
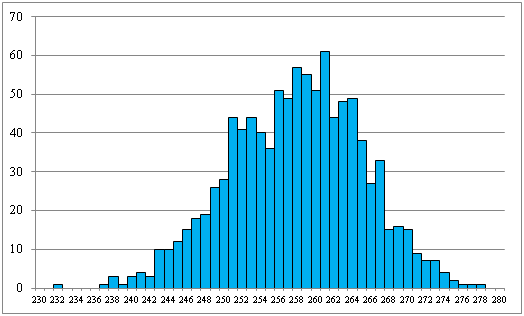
On the slideshow above, you can cycle between the two pictures by clicking on the arrow icons. The first graph is a scatterplot of Labour’s results against the Conservatives’ across our 1000 simulations. Those points which appear above the diagonal line are victories for Labour, those which appear below are victories for the Conservatives. The exact breakdown of the results are:
This is a surprisingly strong prediction from the model, and will be good news for Ed Miliband and his party. The extent of Labour’s advantage is apparent on the second picture on the slideshow, which shows the Conservative lead over Labour. Here we can see that Labour’s lead could be reasonably significant. Indeed, 53.0% of simulations saw a Labour lead of at least 20 seats.
However, aside from Labour’s advantage, the other striking aspect of our results is the lack of any majority. With 650 seats available, 326 are needed for a majority. The closest any party was to a majority was Labour, with 300 in one simulation, and this isn’t anywhere near. Therefore, perhaps the strongest prediction our model makes is that no party will be in complete control of the country in spring. Given the disaster for the Liberal Democrats that entering a coalition was, it seems likely that no party will be eager to be a junior partner in a coalition, so we might be seeing the first minority government since 1997.
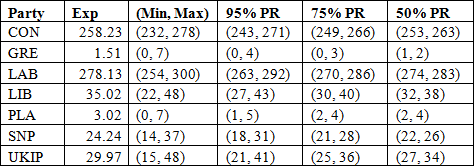
Prediction ranges and expected seats
For each party we will give the 95%, 75% and 50% prediction ranges. These are just the ranges within which that percentage of results fell into. If a party’s 95% prediction range is from 90-110, then this means that we have 95% confidence in such a result.
We will also give the expected number of seats for each party. This is simply worked out by summing the party’s probabilities across every constituency they stand in. So for example, if a party stood for four seats, and had chances of winning those of 75%, 50%, 15% and 4%, then their expected number of seats would be 0.75 + 0.5 + 0.15 + 0.04 = 1.44.
Below are these statistics for each party, along with their minimum and maximum seat return (which essentially make up the 100% prediction range):
- Conservative win: 5.0%
- Labour win: 93.7%
- Tie: 1.3%
This is a surprisingly strong prediction from the model, and will be good news for Ed Miliband and his party. The extent of Labour’s advantage is apparent on the second picture on the slideshow, which shows the Conservative lead over Labour. Here we can see that Labour’s lead could be reasonably significant. Indeed, 53.0% of simulations saw a Labour lead of at least 20 seats.
However, aside from Labour’s advantage, the other striking aspect of our results is the lack of any majority. With 650 seats available, 326 are needed for a majority. The closest any party was to a majority was Labour, with 300 in one simulation, and this isn’t anywhere near. Therefore, perhaps the strongest prediction our model makes is that no party will be in complete control of the country in spring. Given the disaster for the Liberal Democrats that entering a coalition was, it seems likely that no party will be eager to be a junior partner in a coalition, so we might be seeing the first minority government since 1997.
Prediction ranges and expected seats
For each party we will give the 95%, 75% and 50% prediction ranges. These are just the ranges within which that percentage of results fell into. If a party’s 95% prediction range is from 90-110, then this means that we have 95% confidence in such a result.
We will also give the expected number of seats for each party. This is simply worked out by summing the party’s probabilities across every constituency they stand in. So for example, if a party stood for four seats, and had chances of winning those of 75%, 50%, 15% and 4%, then their expected number of seats would be 0.75 + 0.5 + 0.15 + 0.04 = 1.44.
Below are these statistics for each party, along with their minimum and maximum seat return (which essentially make up the 100% prediction range):
Conclusion
As 95% is the standard confidence level used in formal statistics, we will treat any outcome with a likelihood of more than 95% as a fully confident prediction. So, to summarise the results, our predictions for the 2015 general election are as follows:
It will be exciting for us here to see if the results in the spring fall within our 95% prediction ranges.
As 95% is the standard confidence level used in formal statistics, we will treat any outcome with a likelihood of more than 95% as a fully confident prediction. So, to summarise the results, our predictions for the 2015 general election are as follows:
- There is a 93.7% chance of a Labour victory
- The Lib Dems have a 71.9% chance of holding on to third place, ahead of UKIP
- UKIP will gain at least 20 seats, whilst the SNP will gain at least 10
- No party will hold an overall majority, leading to another hung parliament
It will be exciting for us here to see if the results in the spring fall within our 95% prediction ranges.
General Election articles
Previous: Modelling the General Election
Next: General Election Simulator - March Update
Previous: Modelling the General Election
Next: General Election Simulator - March Update
 RSS Feed