
by Adrian Worton
Introduction
Last week we unveiled the TGIAF simulator for the 2014 World Cup. Now, we are going to run our simulator a thousand times, and look at our eventual output.
Introduction
Last week we unveiled the TGIAF simulator for the 2014 World Cup. Now, we are going to run our simulator a thousand times, and look at our eventual output.
If we take it that our simulator brings up results in accordance with realistic probabilities, then the results of our multiple simulations give us an idea of the overall probabilities for how each team will do.
Firstly, we need to know if a thousand simulations is a big enough sample size to accurately replicate the true probability of an event happening.
Testing our Simulations
We have worked out the true probabilities that each side qualifies from its group. The method used to find these probabilities is fairly arduous, for details see Appendix 1. For these to be ‘true’ probabilities, we are assuming that the bookies’ odds for each individual match is a representation of the true likelihood of each possible result in each match. For justification of this, see our earlier article on interpreting odds.
If we plot the probabilities that each team qualify from their group against the percentage of times they qualify from their group in our simulations, we get the following graph:
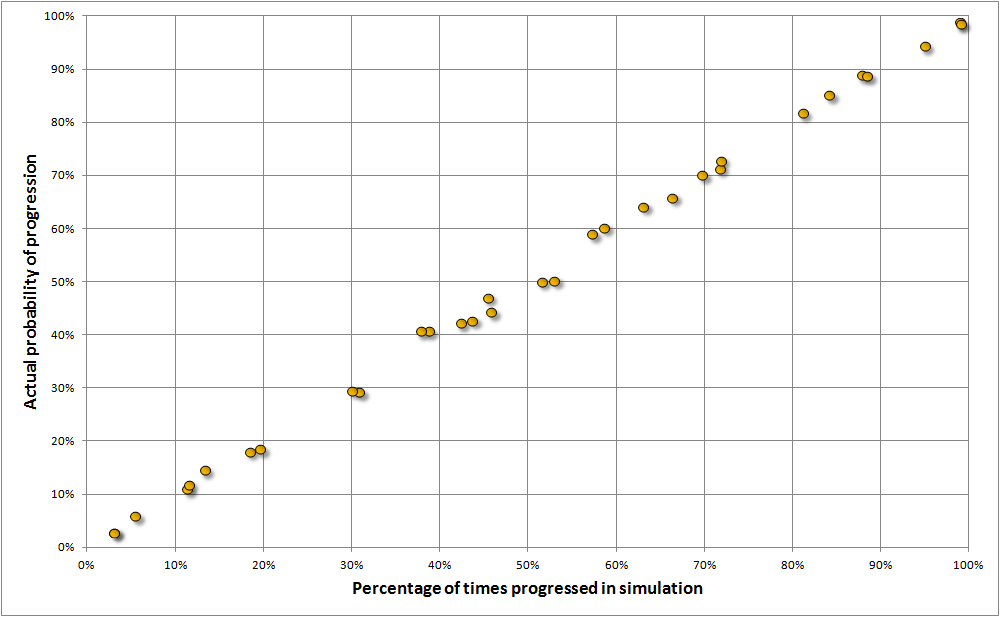
We can see that our simulations are very close to the true probabilities. This means that for the later stages, we are going to take the results of our simulation as a reflection of the true probabilities that each side gets that far. This is important, because working out the probabilities for the later stages becomes even more complicated than it was for the group stages.
Simulation Results
For each simulation, we have taken note of where each team finishes, and counted how many times they finished in each stage. The results of this can be seen below:
Simulation Results
For each simulation, we have taken note of where each team finishes, and counted how many times they finished in each stage. The results of this can be seen below:
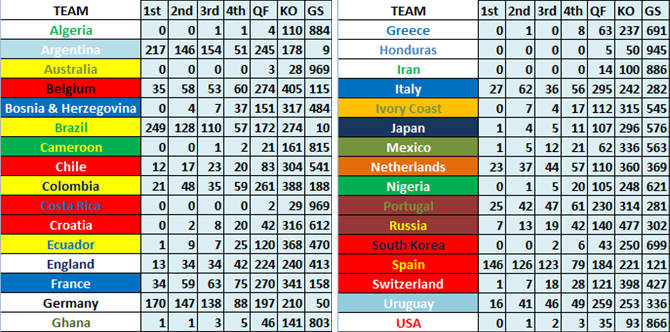
(Where QF = losing in the quarter finals, KO = losing in the round of 16, GS = getting knocked out in the group stages)
We can convert these values into cumulative probabilities showing the chances of reaching each stage:
We can convert these values into cumulative probabilities showing the chances of reaching each stage:
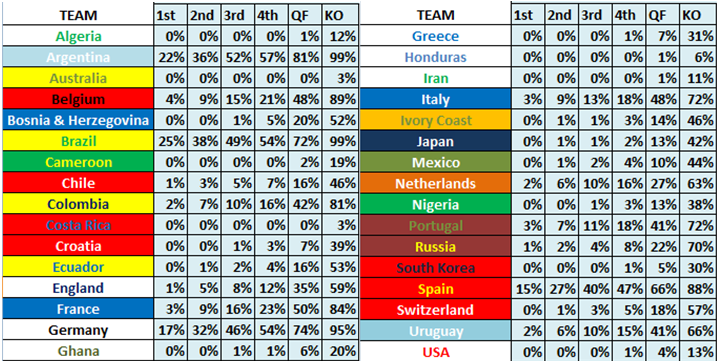
Taking England as an example, there is a 59% chance of them getting out of their group, a 35% chance of them making the quarter-finals, a 12% chance of making the semi-finals, a 8% chance of making the top 3, a 5% chance of making the final, and a 1% chance of winning. This also shows that there is sadly only a 7% chance of 2014 seeing the first African team making the semi-finals, and a 1% chance of a first Asian finalist.
Needless to say, where our table says “0%”, it does not mean there is zero chance of that likelihood happening, it is just rounded down, so it means there is a less than 0.5% chance of that event occurring.
So Who Will Win?
The graph below shows the proportion of the time each team won the World Cup in our simulation. This can be taken as the probability that they will indeed go on to win in Brazil this year.
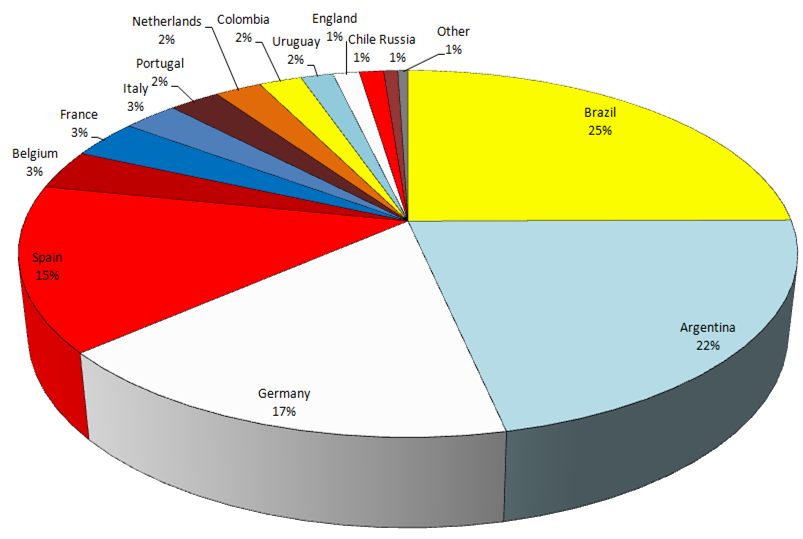
So we can see that there are essentially three divisions of likelihood the teams fall into. The lowest division is the one involving all the teams in the “Other” category, whose names don’t appear on the above graph and who stand a very small chance of making a serious impression on the tournament.
The next category is the chasing pack, teams who are unlikely to win the tournament, but who could see a challenge materialise with the right results.
And the final category is the big four: Brazil, Argentina, Germany and Spain, who are the realistic contenders to lift the Jules Rimet trophy, and for whom anything less than a semi-final spot will be seen as a failure and a missed opportunity.
Conclusion
As mentioned when we unveiled our simulator, a one-off simulation does not tell us anything worthwhile about what might happen in this summer’s tournament. However, by running the simulator multiple times, the overall patterns can be seen.
We will be able to use these powerful results in order to see if there are any longer-term odds which are under- or over-priced.
Appendix 1 - true probabilities
In a given World Cup group, there are 6 matches, each with 3 possible outcomes. Therefore the number of possible combinations of results is 3^6 = 729.
For each of these combinations, the probability of it occurring needs to be calculated. This is achieved by multiplying the probability of all six results together, which can be expressed as:
p[c] = p[1] x p[2] x p[3] x p[4] x p[5] x p[6]
Where p refers to a probability, c is the combination, and 1, 2, etc are the six matches.
We then need to work out which teams qualify, given a particular combination of matches. Firstly, the points total for each team is found. If two teams are distinctly clear in the top two positions, then clearly they are the ones to progress, and are given the value 1 (the probability they go through), whilst the other teams are given a value of 0.
However, there are a number of scenarios where multiple teams can finish level on points across the boundary for qualification. The simplest of these is when two teams are level on points, and take up 2nd and 3rd position. In this case, the two teams are given a value of 0.5. The same applies when all four are level on points.
The next scenario is when three teams are tied in 1st, 2nd and 3rd place. In this case, each team is given the value 2/3, since that is the chance they progress from this stalemate (as we do not take goal difference into account). Similarly, for three teams tied in 2nd, 3rd and 4th position, they are given values of 1/3 each.
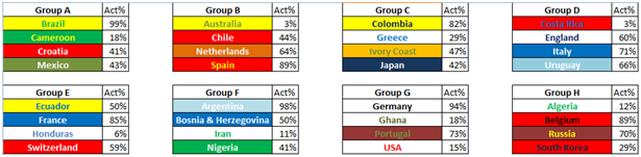
If we now multiply the chance of progression for each team by the chance of each possibility occurring, and sum all 729 resulting values for each side, we get their overall probability of progressing from the group. Below is the list of each team’s probability of getting to the group stages:
In a given World Cup group, there are 6 matches, each with 3 possible outcomes. Therefore the number of possible combinations of results is 3^6 = 729.
For each of these combinations, the probability of it occurring needs to be calculated. This is achieved by multiplying the probability of all six results together, which can be expressed as:
p[c] = p[1] x p[2] x p[3] x p[4] x p[5] x p[6]
Where p refers to a probability, c is the combination, and 1, 2, etc are the six matches.
We then need to work out which teams qualify, given a particular combination of matches. Firstly, the points total for each team is found. If two teams are distinctly clear in the top two positions, then clearly they are the ones to progress, and are given the value 1 (the probability they go through), whilst the other teams are given a value of 0.
However, there are a number of scenarios where multiple teams can finish level on points across the boundary for qualification. The simplest of these is when two teams are level on points, and take up 2nd and 3rd position. In this case, the two teams are given a value of 0.5. The same applies when all four are level on points.
The next scenario is when three teams are tied in 1st, 2nd and 3rd place. In this case, each team is given the value 2/3, since that is the chance they progress from this stalemate (as we do not take goal difference into account). Similarly, for three teams tied in 2nd, 3rd and 4th position, they are given values of 1/3 each.
If we now multiply the chance of progression for each team by the chance of each possibility occurring, and sum all 729 resulting values for each side, we get their overall probability of progressing from the group. Below is the list of each team’s probability of getting to the group stages:
 RSS Feed