by Adrian Worton
Last December we unveiled the TGIAF General Election simulator, which uses bookmakers' odds to generate results across the nation. However, if a day is long time in politics, then three months is an aeon. Therefore, it is time to update the odds within our model in order to see what has changed.
Last December we unveiled the TGIAF General Election simulator, which uses bookmakers' odds to generate results across the nation. However, if a day is long time in politics, then three months is an aeon. Therefore, it is time to update the odds within our model in order to see what has changed.
We will not delve into how the simulator has been constructed, as this is all available in our earlier article.
Aside from the new probabilities, we can now include Northern Irish constituencies into our model, as odds for those are now available.
Constituencies
You can use the embedded Excel sheet below to view the latest probabilities for your own constituency. Simply look through the list on the drop-down menu.
Changes since December
To measure the changes experienced by each party we will use the 'Expected' number of seats won. This is simply calculated by summing the probabilities across every constituency for each party. For example, if Labour had probabilities of 80%, 50% and 10% across three constituencies, their expected return would be 0.8+0.5+0.1 = 1.4.
Below are the results for the parties within our model, including the percentage increase/decrease:
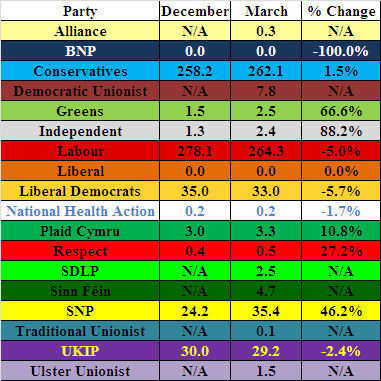
We will quickly go through the winners and losers:
Winners
Greens - a large increase for the party, with two seats moving from a possibility to a likelihood. Hashtag Green surge.
SNP - with polls across Scotland predicting Nicola Sturgeon's party to thrash Labour north of the border, this is reflected in a huge upswing of nearly 50% within our model.
Conservatives - in line with polls across the country, they have seen a decent improvement in relation to Labour. However, unlike in the polls they are still behind Ed Miliband's party.
It is notable that, excluding Independent candidates, the four biggest increases are all in left-wing parties.
Losers
Labour - a decrease in almost 15 seats sees Labour's comfortable lead over the Conservatives reduced to within a bacon sandwich.
Liberal Democrats - a small decrease in expected seats sees them move into fourth position behind the SNP.
UKIP - less of a loser than the others, but has their momentum slowed up?
BNP - despite moving from "0.0" to "0.0", this is actually a decrease of 100%, as their chances of winning disappears entirely within the model (which means their odds are at least 100/1 in all constituencies).
Summary
The election in May will let us see whether our modelling approach has been successful. I personally have reservations about the results in that it seems to over-state the likelihood of second-favourites winning in their constituency. However, since this method is used fairly in both December and now, we can see with a much higher degree of certainty how the parties have progressed.
An interactive version of the updated model (complete with a map!) is available at our General Election Simulator page.
General Election articles:
Previous: TGIAF General Election predictions
Next: Who Can Decide the Election?
Previous: TGIAF General Election predictions
Next: Who Can Decide the Election?
 RSS Feed