by Adrian Worton
One of the main things to come out of the results of the 2015 UK General Election was the public's frustration with the current First Past the Post system. Many discrepancies between the votes and the results were noted. For example, UKIP and the Green Party accumulated 12.6% and 3.8% of the vote respectively, but each only finished with 1 seat (0.2% of the total available). Meanwhile, the Conservatives won a majority (with 50.8% of the seats) with only 36.9% of votes. And the SNP achieved 56 of 59 Scottish seats (94.9%) with only 50.0% of the votes in Scotland.
One of the main things to come out of the results of the 2015 UK General Election was the public's frustration with the current First Past the Post system. Many discrepancies between the votes and the results were noted. For example, UKIP and the Green Party accumulated 12.6% and 3.8% of the vote respectively, but each only finished with 1 seat (0.2% of the total available). Meanwhile, the Conservatives won a majority (with 50.8% of the seats) with only 36.9% of votes. And the SNP achieved 56 of 59 Scottish seats (94.9%) with only 50.0% of the votes in Scotland.
It should be expected that a democratic election results in a government which reflects the will of its people. Therefore, we see that the results thrown up by the recent election don't achieve this aim particularly well.
In this article we will try and find a measure of this discrepancy, and place the UK into context with Europe.
Method
For each nation, we will take the results of the most recent election. As elections can have hundreds of different parties competing, we will limit our measurement to parties who gathered at least 1% of the national vote.
In the UK General Election, there were six parties fulfilling this criteria: the Conservatives, Labour, UKIP, the Liberal Democrats, the SNP and the Greens.
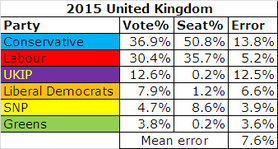
For each party, we then find the difference between the proportion of votes they achieved and the proportion of seats. On the left you can see these scores for the UK parties.
We simply take the mean error across all parties. So we can see that this is 7.6% for the UK. In other words, parties are misrepresented in Westminster by an average of 7.6% (either above or below the level it should be).
Comparison
In order to get an idea of whether this is particularly high, we can work out these values for the equivalent elections across the EU. Some other nations have more than one election, such as France, who have Presidential, National Assembly and Senate elections. The closest equivalent to the UK General Election in each case is chosen for each nation. In the case of France, that is the National Assembly, which is the country's lower house. We have also included the elections for the Scottish Parliament, the National Assembly for Wales and the Northern Ireland Assembly.
Below we can see the mean errors for all 31 nations in our study:
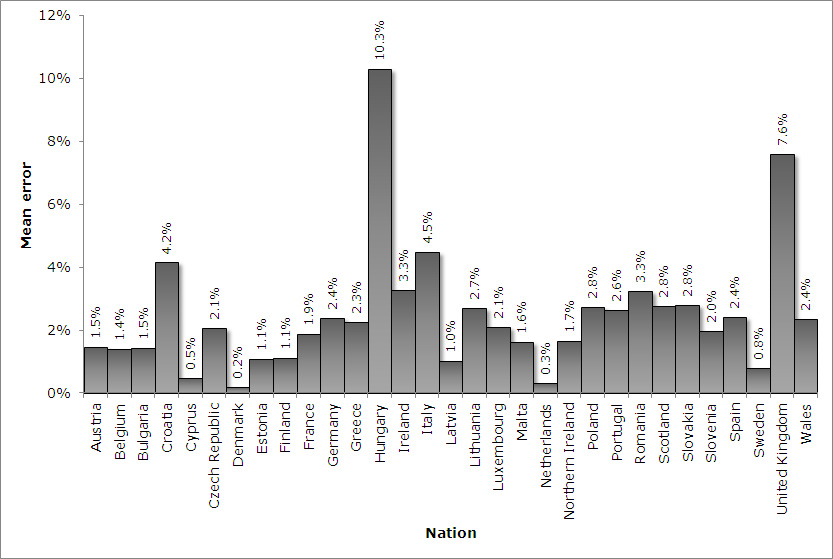
We see that the UK's value is indeed extraordinarily high, with only the Hungarian elections worse for representing the will of its people. Hungary uses the Parallel Voting method, which is also used in the intensely democratic nation of Russia.
If you wish to see the state of elections in each country, you can use the drop-down list below. The closer points are to the diagonal line, the more proportional that nation's election is.
If you wish to see the state of elections in each country, you can use the drop-down list below. The closer points are to the diagonal line, the more proportional that nation's election is.
UK through the years
It may have occurred that this year's result in the UK is unusually disproportional, with factors such as the rise of UKIP and the SNP being unique to this year's vote. Therefore, we can also apply our method to every UK General Election from 1983 onwards, in order to see whether 2015 was an anomaly:
It may have occurred that this year's result in the UK is unusually disproportional, with factors such as the rise of UKIP and the SNP being unique to this year's vote. Therefore, we can also apply our method to every UK General Election from 1983 onwards, in order to see whether 2015 was an anomaly:
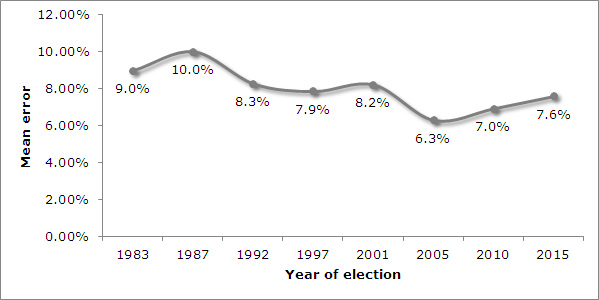
The short answer is that no, it wasn't. In fact, the past three years have seen the lowest mean error scores. And all eight scores would have landed the UK in second position in our European rankings.
Conclusion
It was evident from witnessing the election results that the UK elections use a system which has led to large parts of the population becoming disenfranchised with the system. Unfortunately, we cannot easily measure whether there is a relationship between the proportionality of an election and the turnout as each country has a different electoral system. Crucially, most of the elections we have studied are unlike the UK's in that they don't decide the leader of the country, therefore reducing the importance of the vote. However, it is hard to argue that a proportional system in the UK would increase voter apathy.
The main argument in favour of First Past the Post is that is guarantees majorities. The 2010 result shows that this will not always be the case, and indeed the 2015 vote was widely expected to result in another hung parliament, so much so that a big swing in favour of the Conservatives only secured them a majority of 12 seats, which is very slender compared to those in the past.
But even aside from the fact that FPTP can no longer be relied upon to produce the results we expect, the question has to be asked whether a majority is a good thing. This essentially means that if it can get its whole force of MPs behind a motion, very little can stop the party in power. This is not necessarily a good thing, as they do not have to work at convincing opposition MPs to agree with them, when persuasive debating and compromise should be a key aspect of politics. Most governments in Europe operate through minority governments and coalitions with an effectiveness no less than the British government.
 RSS Feed