
by Adrian Worton
In our update yesterday we looked at which seats have changed in the last week, and we saw a handful of seats which have seen the gap between first and second narrow.
Today we will be looking at these and other marginal constituencies, and seeing which are the key seats to look out for on Friday morning.
What counts as a marginal seat?
We will be measuring the difference in percentage points between the favourite in a constituency and the second-favourite. Below is a histogram of these gaps for all 650 seats. Each bar represents a 5% boundary, so for instance the one labelled '45%' is all percentages greater than 40% and less than 45%. Also, note the logarithmic scale, which we have used because the huge size of the final category would otherwise make the graph impossible to read.
We will be measuring the difference in percentage points between the favourite in a constituency and the second-favourite. Below is a histogram of these gaps for all 650 seats. Each bar represents a 5% boundary, so for instance the one labelled '45%' is all percentages greater than 40% and less than 45%. Also, note the logarithmic scale, which we have used because the huge size of the final category would otherwise make the graph impossible to read.
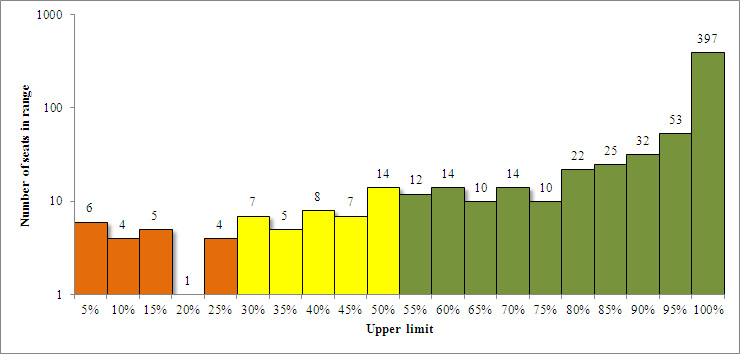
So of the 650 seats, over half of them are near-certainties, with the gap between first and second being over 95%. These are the constituencies where it is easy for voters to become disenchanted with the system, as their vote has a negligible impact under the first-past-the-post system.
We will define a marginal seat as one where the gap is under 50%, and split these seats into two categories: those which are on a knife-edge (<25%; orange on the graph above), and those where the contest has a clear favourite (25-50%; yellow).
For a full list of the seats which we've classified as marginal, see the appendix at the bottom of this article.
How could the marginals affect the final outcome?
To measure this, we will look at the following scenarios for each party:
We will assume that all safe seats (where the difference between the parties is over 50%; green on the histogram above) are won by the favourite.
We will define a marginal seat as one where the gap is under 50%, and split these seats into two categories: those which are on a knife-edge (<25%; orange on the graph above), and those where the contest has a clear favourite (25-50%; yellow).
For a full list of the seats which we've classified as marginal, see the appendix at the bottom of this article.
How could the marginals affect the final outcome?
To measure this, we will look at the following scenarios for each party:
- Worst case scenario - the party loses every marginal.
- Poor performance - the party only wins the marginal seats where its lead is over 25%, but loses every close seat.
- Most likely - the party wins all seats it is favourite in, but loses all the ones where it's second-favourite.
- Good performance - the party wins all the knife-edge marginals it is contesting, but loses any other seats it is not favourite for.
- Best case scenario - the party wins every marginal.
We will assume that all safe seats (where the difference between the parties is over 50%; green on the histogram above) are won by the favourite.
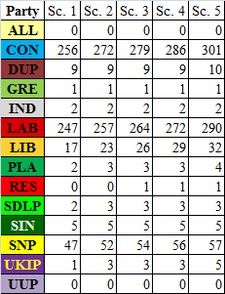
On the left we can see the totals for each party under each scenario.
For those where the tallies don't change at all, such as for the Greens, Sinn Féin and independent candidates, this suggests that this is very likely their final tally.
On the other end of the scale, both UKIP and the Liberal Democrats see their scores vary wildly depending on the scenario, showing how reliant they are on coming through in marginal constituencies.
We can see that in every scenario, the Conservatives have a lead of around 10 seats over Labour. However, as the two parties are contesting a large number of the marginal seats against each other, we know that a strong performance of one will result in a weak performance of the other. Therefore, we need to look at how many of the marginals Labour need to win in order to take the lead from the Conservatives.
What do Labour need?
There are multiple ways to look at this, but we are going to start from scenario 3, and introduce a "marginal threshold", where all marginals with the difference between the favourite and second-favourite under this threshold either go in favour of Labour, or against the Conservatives (or both).
Below we can see the result of increasing this threshold:
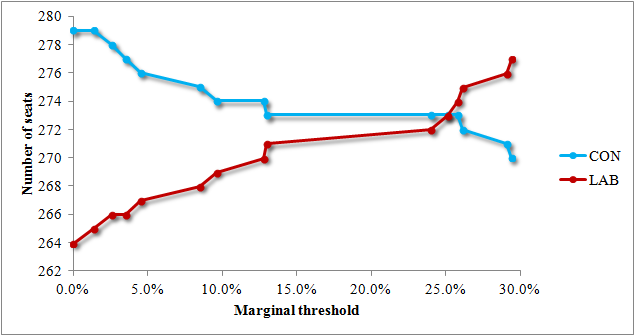
We see that the threshold does not need to be very high for Labour to rapidly close the gap on their rivals, as at 13.0% the difference is only 2. However, it takes up until 25.1% for Labour to actually catch up the Conservatives.
Conclusion
This suggests that Labour would need a big swing in order for them to finish night with the most seats, although a good couple of days before the vote could be enough for them to narrow the gap considerably below that which is expected.
However, it should be stressed that it is clear that no party will get a majority (even in their best-case scenario, the Conservatives only ended up with 301 seats), it is not going to be purely a matter of who ends up with the most seats which determines who wins the election, but it could have a large say in who has the best chance of forming a coalition.
Finally, a quick look at the 150 constituencies which make up Sky's "In the margins" list. This is their list of the seats they think are where the election will be decided. By getting a histogram the percentage difference between the favourite and second-favourite as we did before, but only for Sky's 150 seats, we can see how good their choices are:
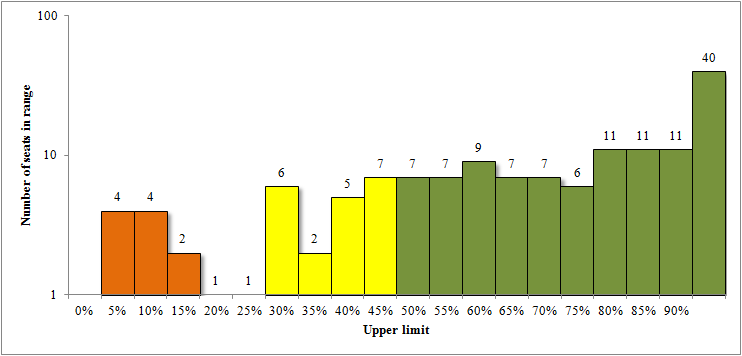
We can see that they fail to identify the seats which see as the very closest - the six seats where the gap is under 5%, and in fact they only highlight 10 of the 20 seats which are in our knife-edge category.
We can see that this histogram is distributed in a very similar way to the one above, indicating that in fact Sky's list is not much better than randomly choosing seats, once you have taken away the near-certainties.
We can see that this histogram is distributed in a very similar way to the one above, indicating that in fact Sky's list is not much better than randomly choosing seats, once you have taken away the near-certainties.
Appendix - list of TGIAF marginal seats
The seats here are listed in the following way:
[Seat Name] ([Favourite]/[2nd-favourite]) - [percentage difference]
Knife-edge marginals
Dunfermline & West Fife (LAB/SNP) - 0.5%
Edinburgh South (SNP/LAB) - 1.4%
Torbay (LIB/CON) - 1.5%
Northampton North (CON/LAB) - 2.6%
North Cornwall (CON/LIB) - 3.5%
Halesowen & Rowley Regis (CON/LAB) - 4.5%
St Ives (LIB/CON) - 5.0%
Norwich North (CON/LAB) - 8.5%
Birmingham, Yardley (LAB/LIB) - 8.6%
Pudsey (CON/LAB) - 9.6%
Berwickshire, Roxburgh & Selkirk (CON/LIB) - 12.5%
East Renfrewshire (SNP/LAB) - 12.8%
Finchley & Golders Green (CON/LAB) - 13.0%
Ipswich (LAB/CON) - 13.1%
Cheadle (LIB/CON) - 14.1%
Stockton South (LAB/CON) - 17.2%
Harrow East (LAB/CON) - 20.2%
Rutherglen & Hamilton West (LAB/SNP) - 20.3%
Wirral West (LAB/CON) - 23.4%
Bradford West (RES/LAB) - 24.0%
Other maginals
Dumfries & Galloway (SNP/LAB) - 25.1%
Arfon (PLA/LAB) - 25.8%
South Thanet (UKIP/CON) - 25.9%
Croydon Central (CON/LAB) - 26.1%
Nuneaton (LAB/CON) - 28.5%
Stevenage (CON/LAB) - 29.1%
Crewe & Nantwich (CON/LAB) - 29.4%
Brecon & Radnorshire (LIB/CON) - 30.7%
Brighton, Kemptown (LAB/CON) - 30.7%
Keighley (LAB/CON) - 31.1%
Ceredigion (LIB/PLA) - 32.0%
Rossendale & Darwen (CON/LAB) - 32.0%
Cannock Chase (LAB/CON) - 35.5%
Watford (CON/LIB) - 35.7%
Ealing Central & Acton (LAB/CON) - 37.2%
Coatbridge, Chryston & Bellshill (SNP/LAB) - 38.7%
South Swindon (CON/LAB) - 39.2%
City of Chester (LAB/CON) - 39.3%
Bermondsey & Old Southwark (LIB/LAB) - 39.4%
Worcester (CON/LAB) - 39.9%
Boston & Skegness (CON/UKIP) - 40.6%
Portsmouth South (CON/LIB) - 41.6%
Bury North (LAB/CON) - 42.9%
Morecambe & Lunesdale (LAB/CON) - 43.6%
Peterborough (CON/LAB) - 44.4%
Milton Keynes South (CON/LAB) - 44.6%
Pendle (CON/LAB) - 45.0%
Gloucester (CON/LAB) - 45.0%
Glasgow North East (LAB/SNP) - 45.1%
East Lothian (SNP/LAB) - 45.3%
Amber Valley (LAB/CON) - 45.5%
Sutton & Cheam (LIB/CON) - 47.0%
North Devon (CON/LIB) - 48.4%
Sheffield, Hallam (LIB/LAB) - 48.9%
Glenrothes (SNP/LAB) - 48.9%
Rochester & Strood (CON/UKIP) - 49.1%
Cheltenham (LIB/CON) - 49.1%
Thurrock (UKIP/LAB) - 49.2%
Belfast South (SDLP/DUP) - 49.3%
Dumfriesshire, Clydesdale & Tweeddale (SNP/CON) - 49.9%
Carmarthen West & South Pembrokeshire (CON/LAB) - 50.0%
For more details on the state of individual constituencies, please check our General Election Simulator page.
General Election articles
Previous: General Election Simulator - May Update
Next: General Election Simulator - Final Update
Previous: General Election Simulator - May Update
Next: General Election Simulator - Final Update
 RSS Feed