by Dr Adrian Worton
We have spent the last month collecting data on transfers made by Premier League sides, which will help us see which transfer policies have worked. This is the first of a handful of articles which will look at different aspects of this data.
In this article, we will look at how strong the relationship is between the price paid for a player and their level of performance. We can then use this to say which were the best and worst transfers made in recent seasons.
The data
The set of transfers we will be using for this and future articles is all incoming transfers made by Premier League clubs from the 2013/14 season onwards (so covering the previous four seasons). Only players that have played at least ten Premiership matches for their new club are counted.
The problematic part is measuring the level of performance for each player. Due to the nature of football, each player performs a different role and therefore can't easily be compared. For example, counting goals might give a measure of the quality of a striker, but does little to measure other players. In fact, it is not even that easy to measure the performance of strikers this way, since it doesn't take into account the number of chances needed, nor any other factors.
Unfortunately, it is beyond our resources to devise a new method for objectively comparing football players. Therefore, the player ratings given by the website WhoScored are used. For each player in our data set, we calculate their average rating in their first three seasons with their new club. If the club was relegated in that time, we stop counting at the point of relegating, as to avoid inflating a player's score with ratings from the Championship.
The effect of spending money
In order to see whether spending more on a player returns you better performances, we split the transfers in the data set into £10m-wide bands, with separate groups for free transfers and loans. The average rating for each group can be seen below:
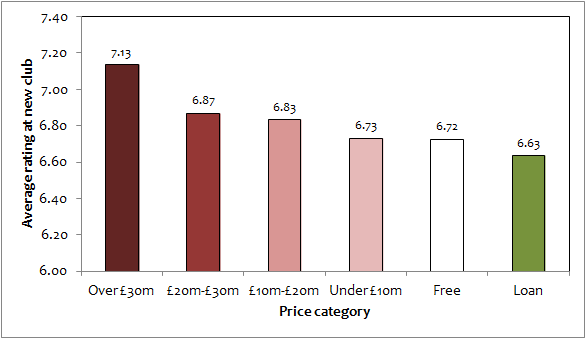
The striking thing is that other than the highest category (over £30m), there is not a huge difference between the groups. In particular, there doesn't seem to be a different between transfers in the range £20m - £30m and those in the range £10m - £20m. Nor is there barely any difference between the under £10m group and free transfers. Meanwhile, the lowest group are loan transfers, albeit not significantly lower than the free category.
This suggests that the only way to guarantee quality is to spend big, something which Premiership clubs are doing; the number of players signed for £30m in our data set started at 4 in 2013/14, moving up to 5 in 2014/15, 6 in 2015/16 before jumping to 10 in 2016/17.
We can plot all transfers in our data set, comparing the price paid and the average rating. This can be seen below. Note that there are two scatter graphs, a standard one and one with a logarithmic scale (explained here). We have excluded free transfers and loans as they can't be shown on a logarithmic scale.
Unsurprisingly, we can see huge variability in performance, particularly with the cheaper transfers. One thing to note is that the highest-performing players perform at the same level regardless of fee (i.e. the best-performing players signed for under £10m perform at roughly the same level as the best players signed for over £30m - with a rating above 7.4). However, the number of players with particularly low ratings is far lower for the highest transfers fees. This backs up the previous assertion that spending big should at least ensure that you avoid signing a dud.
Which were the best and worst transfers?
The regression line on the two graphs above was the best fit for the data, and uses the following formula, where r represents the average rating, and f represents the fee:
Which were the best and worst transfers?
The regression line on the two graphs above was the best fit for the data, and uses the following formula, where r represents the average rating, and f represents the fee:
r = -0.00002f^2 + 0.0111f + 6.6776
We can then substitute a player's fee into the above equation, and it will give us an estimate of what level of performance they should have been playing at. By substituting this expected value from the actual rating, we can see the best and worst signings made. Firstly, the ten best signings:
Player |
Season |
Sold from |
Sold to |
Price (£m) |
Rating |
Exp. rating |
Diff |
Payet, D |
15/16 |
Marseille |
West Ham United |
12.75 |
7.67 |
6.82 |
0.85 |
Kanté, N |
15/16 |
Caen |
Leicester City |
7.65 |
7.61 |
6.76 |
0.85 |
Sánchez, A |
14/15 |
Barcelona |
Arsenal |
36.13 |
7.80 |
7.05 |
0.75 |
Amavi, J |
15/16 |
Nice |
Aston Villa |
9.35 |
7.48 |
6.78 |
0.70 |
van Dijk, V |
15/16 |
Celtic |
Southampton |
13.35 |
7.51 |
6.82 |
0.69 |
Davies, C |
13/14 |
Birmingham City |
Hull City |
2.25 |
7.37 |
6.70 |
0.67 |
Alonso, M |
16/17 |
Fiorentina |
Chelsea |
19.55 |
7.51 |
6.89 |
0.62 |
Fazio, F |
14/15 |
Sevilla |
Tottenham Hotspur |
8.50 |
7.39 |
6.77 |
0.62 |
Antonio, M |
15/16 |
Nottingham Forest |
West Ham United |
8.08 |
7.36 |
6.77 |
0.59 |
Alli, D |
14/15 |
MK Dons |
Tottenham Hotspur |
5.64 |
7.30 |
6.74 |
0.55 |
The names on this list are not a huge surprise. Generally, the list is dominated by players signed for modest fees who have put in performances of a far higher level. With this in mind, it is a great compliment to Alexis Sánchez that he makes the list, given that he cost £36.13m. His average rating of 7.80 is the highest of all players in the data set.
It is surprising that two players (Jordan Amavi and Curtis Davies) signed for teams that they were then relegated with. However, this really just emphasises that football is a team sport.
Now, for the list of the worst signings:
It is surprising that two players (Jordan Amavi and Curtis Davies) signed for teams that they were then relegated with. However, this really just emphasises that football is a team sport.
Now, for the list of the worst signings:
Player |
Season |
Sold from |
Sold to |
Price (£m) |
Rating |
Exp. rating |
Diff |
Batshuayi, M |
16/17 |
Marseille |
Chelsea |
33.15 |
6.16 |
7.02 |
-0.86 |
Bastón |
16/17 |
Atlético Madrid |
Swansea City |
15.30 |
6.11 |
6.84 |
-0.73 |
Juanmi |
15/16 |
Málaga |
Southampton |
5.95 |
6.06 |
6.74 |
-0.68 |
Ayew, A |
16/17 |
Swansea City |
West Ham United |
20.49 |
6.24 |
6.90 |
-0.66 |
Depay, M |
15/16 |
PSV Eindhoven |
Manchester United |
28.90 |
6.33 |
6.98 |
-0.65 |
Janssen, V |
16/17 |
AZ Alkmaar |
Tottenham Hotspur |
18.79 |
6.23 |
6.88 |
-0.65 |
Thauvin, F |
15/16 |
Marseille |
Newcastle United |
15.60 |
6.20 |
6.85 |
-0.65 |
Sordell, M |
14/15 |
Bolton Wanderers |
Burnley |
0.54 |
6.04 |
6.68 |
0.64 |
Cuadrado, J |
14/15 |
Fiorentina |
Chelsea |
26.35 |
6.37 |
6.96 |
-0.59 |
Aspas, I |
13/14 |
Celta Vigo |
Liverpool |
9.18 |
6.21 |
6.78 |
-0.57 |
This time the list is mainly made up of either highly-priced signings for big clubs which haven't worked out well, or cheaper signings which have been particularly bad. The bad news for Marvin Sordell is that his rating of 6.04 is the lowest across all players in our data set.
It is no great surprise that two of players in the list (Sordell and Florian Thauvin) were signed by clubs which went on to be relegated, whilst Swansea City and West Ham are currently involved in a relegation battle.
Michy Batshuayi might consider himself unlucky to be rated as the most under-performing signing, as he has mainly been playing from the bench so far at Chelsea. However, £33.15m is a very high price to pay for a bench-warmer. He will have time to turn this around though, unlike many of the players on the list who have been sold on.
Summary
By analysing past transfers, we can begin to get an idea of what tactics work in the transfer market. This is the first of a series of articles where we will get more of an idea of where the best value is to be found, and which clubs are doing the best at finding it.
Sources
Transfermarkt - for a list of all transfers made by Premier League clubs.
WhoScored - for season-by-season ratings of each player's performances.
Transfermarkt - for a list of all transfers made by Premier League clubs.
WhoScored - for season-by-season ratings of each player's performances.
 RSS Feed