by Dr Adrian Worton
Wikipedia is a remarkable website. It is one of the few things on the modern internet that lives up to the ideals and ideas suggested when the internet was emerging. The detail and depth it possesses is hard to even get your head around. And that means it has some truly brilliant obscure information.
One such example is that it has the full list of results for every race of 1968 Hanna-Barbera cartoon Wacky Races. So let's take this data and see who is the ultimate Wacky Racer! We'll look at how different points systems can give different outcomes.
The Racers
For those philistines not familiar with the show, each episode saw a huge race between eleven contenders:
For those philistines not familiar with the show, each episode saw a huge race between eleven contenders:
So that's 22 men and 1 stereotypical woman, in case you were under the illusion that the cartoons were made by a woman called Hannah Barbera. Still, for the standards of the time the characters aren't too offensive.
So let's find out who the ultimate wacky racer is!
Method 1: Olympics
Let's start with the simplest method. Let's see who won the most races. If it's tied, then we'll use number of second places, and so on. This is how the Olympics medal table is done, ultimately.
Here are the results:
So let's find out who the ultimate wacky racer is!
Method 1: Olympics
Let's start with the simplest method. Let's see who won the most races. If it's tied, then we'll use number of second places, and so on. This is how the Olympics medal table is done, ultimately.
Here are the results:
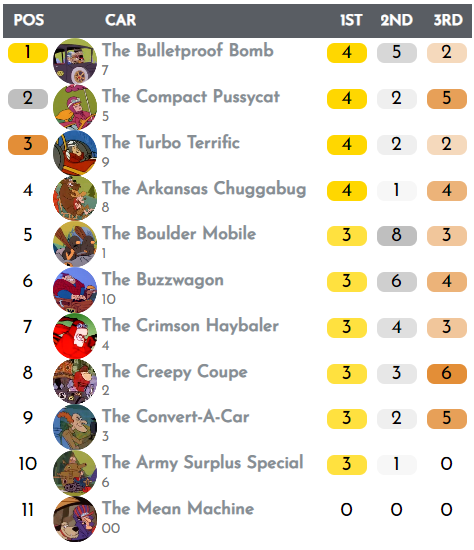
The Ant Hill Mob are probably my favourites, so hurray! They come out on top.
Excitingly, it seems that the 34 episode were pretty much split equally between the 10 "goodie" characters, so the results could be very different with different ranking methods.
Method 2: Average position
This also feels like a fairly obvious way to rank the racers, even if there isn't an obvious parallel in sports (that I can think of).
The results table has a number of incomplete results, so we will give everyone with an unlisted result the average of the possible positions. So say we don't know who finished 8th, 9th and 10th, then all three racers are given 9th place.
Here is the table:
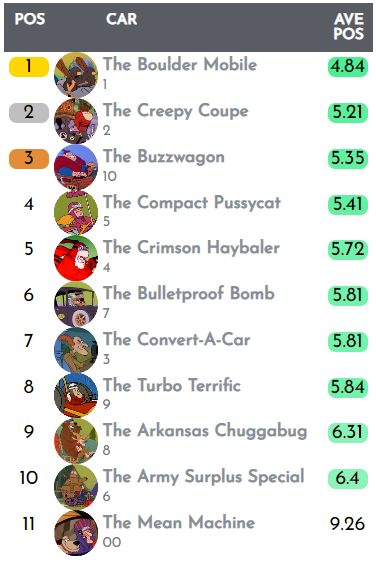
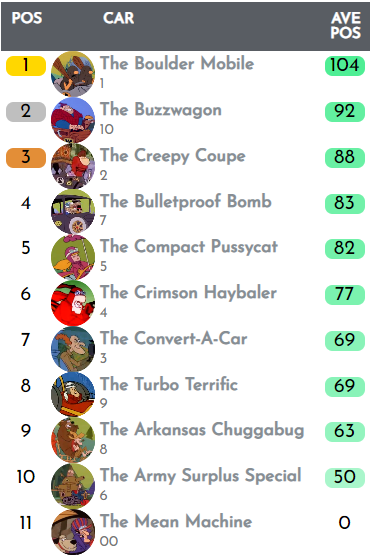
Now the table looks completely different. The Slag Brothers rise to the top from 5th, part of a completely new top 3. Previous winners the Ant Hill Mob are left in 6th and Peter Perfect in 8th, whilst Penelope Pitstop fares better in 4th. One consistent though is that the Army Surplus Special is in 10th, just ahead of perennial wooden spoon collectors Dick Dastardly & Muttley.
Method 1, using races won, ultimately only used 1st and 2nd-placed finishes, meaning the order of the next nine cars was irrelevant. So it perhaps shouldn't be surprising that the table order varies a lot when the next nine positions are used in the overall ranking.
Method 3: NASCAR
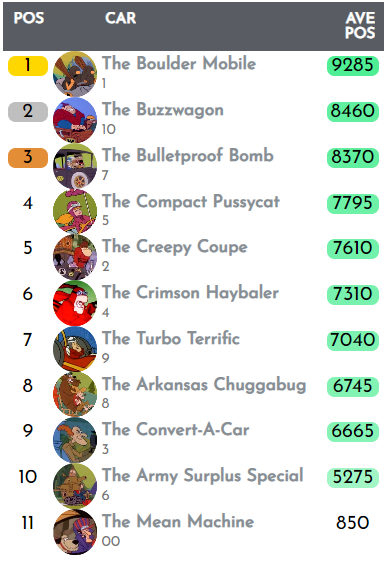
NASCAR is not known for being subtle. And the circular track racing sport has a pretty no-nonsense points system. The cars are given points inverse to their position (so, 1st = 40pts, 2nd = 39pts, 3rd = 38pts... all the way to 39th = 2pts and 40th = 1pt), with the winner also given a 3 point bonus. There are a couple of other bonuses that don't translate to Wacky Races.
Using that system, rescaled for an 11-car race (so, 1st = 11pts, 2nd = 10pts, etc), and keeping the 3 point bonus, this is what we get:
Method 1, using races won, ultimately only used 1st and 2nd-placed finishes, meaning the order of the next nine cars was irrelevant. So it perhaps shouldn't be surprising that the table order varies a lot when the next nine positions are used in the overall ranking.
Method 3: NASCAR
NASCAR is not known for being subtle. And the circular track racing sport has a pretty no-nonsense points system. The cars are given points inverse to their position (so, 1st = 40pts, 2nd = 39pts, 3rd = 38pts... all the way to 39th = 2pts and 40th = 1pt), with the winner also given a 3 point bonus. There are a couple of other bonuses that don't translate to Wacky Races.
Using that system, rescaled for an 11-car race (so, 1st = 11pts, 2nd = 10pts, etc), and keeping the 3 point bonus, this is what we get:
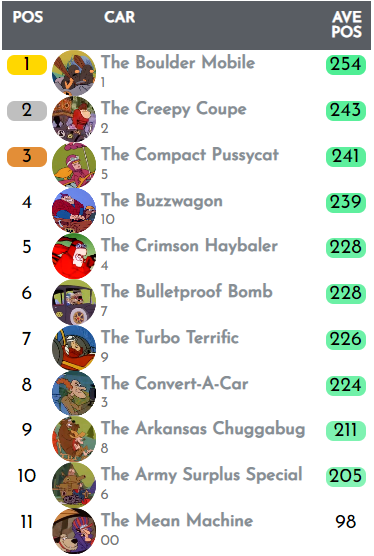
This time, there is very little difference between this and the previous table. There are a few subtle changes to the table though. Penelope Pitstop moves back into the top 3 at the expense of Rufus Ruffcut, Peter Perfect moves up a place and the Ant Hill Mob are level with the Red Max rather than Professor Pat Pending.
We can see how similar the NASCAR points total is to the average position method:
We can see how similar the NASCAR points total is to the average position method:
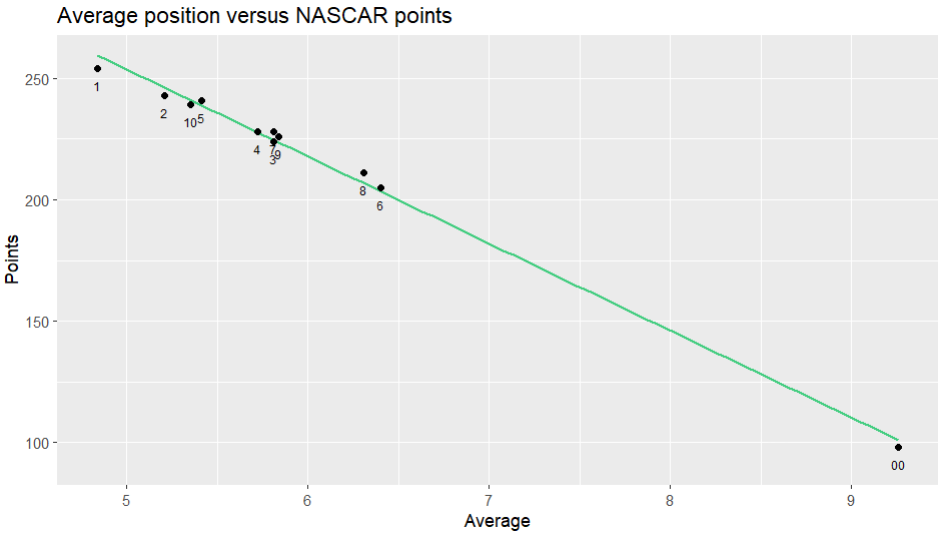
Barring a little rounding, the only difference is the 3 point race win bonus, which slightly boosts those cars which have won a race more than their competitors.
Method 4: Formula One (1961-1990)
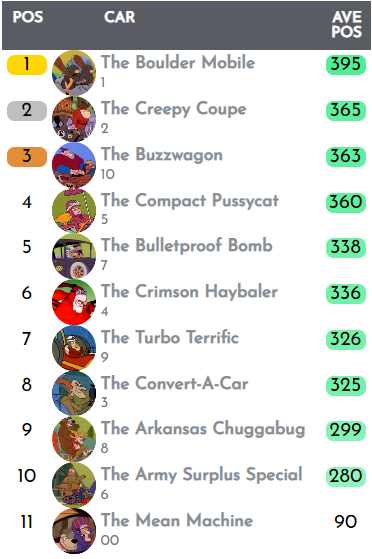
We will move onto the current F1 method next, but first we'll look at the longest-used method. This method awarded 9 points to the winner, then 6, 4, 3, 2, 1 to the drivers finishing 2nd to 6th, with nobody else scoring anything.
The methods used before 1961 and between 1991 - 2002 were only slightly different, so this method covers the vast majority of F1's lifespan.
Here is the table we get:
Method 4: Formula One (1961-1990)
We will move onto the current F1 method next, but first we'll look at the longest-used method. This method awarded 9 points to the winner, then 6, 4, 3, 2, 1 to the drivers finishing 2nd to 6th, with nobody else scoring anything.
The methods used before 1961 and between 1991 - 2002 were only slightly different, so this method covers the vast majority of F1's lifespan.
Here is the table we get:
Rock and Gravel continue to dominate, although Rufus Ruffcut moves up into second, whilst the Ant Hill Mob jump up to 4th.
Method 5: Formula One (2010-)
Now we'll use the current F1 system. The key changes to the previous method is that the top 10 all score points. The breakdown is 25/18/15/12/10/8/6/4/2/1. Since 2019 there has also been a bonus point for fastest lap, which we can't include.
It seems that the race winner is being further rewarded (25 points instead of 9), but previously those 9 points were 50% more than second place and now they're only 39% higher. And indeed, previously the race winner scored 9 times the points that 6th place did, and now it is just over three times more.
This is how our championship looks with this system:
So this championship looks a little bit like a cross between the NASCAR method and the old F1. The Creepy Coupe is in second (like NASCAR), but the Buzzwagon is ahead of the Compact Pussycat (as in old F1). Similarly, the Bulletproof Bomb has overtaken the Crimson Haybaler (as in old F1) but hasn't overtaken the Compact Pussycat (as in NASCAR).
This makes sense. In NASCAR the gaps between the different positions were very small, and in the old F1 system had more exaggerated gaps between the positions than the current system. So let's see what happens when we find a points system with even bigger gaps than the old F1 method.
Method 6: AAA Championships (1916)
The inaugural American Automobile Association Championship, now better known as Indy Car racing, had a pretty extreme points system, with almost double the points available for the race winner than the runner-up.
The top 10 received the following points: 1000/520/270/140/90/60/50/40/30/25 (for races over 350 miles). This is how it affects our table:
The biggest losers here are the Gruesome Twosome, who had been as high as 2nd, but now are down in 5th. The Ant Hill Mob move up to third, but nobody is displacing the Slag Brothers.
If you compare the positions of the racers, they are generally somewhere between where they were in the races won system (Method 1) and the old F1 system (Method 4). For example, the Creepy Coupe were 8th under Method 1 but 3rd under Method 4 - and here they are 5th.
We can consider our first two methods as extremes. At one end, Method 2 (average position) has the smallest 'reward' for finishing in a higher position, and at the other end Method 1 (races won) gives all the reward to the car winning the race.
Reward
Let's formalise this reward. Let us define a variable r, which is the extra reward for finishing a position higher than someone. If you are guaranteed 1 point more than the position below, then r is a percentage increase on that point.
We'll say that 11th place scores 0 and 10th place 1 point. Then 9th place scores:
P9= 1 + (P8 x (1 + r))
And more generally, for position N+1 (where N is the racer who finished the position below):
PN+1 = 1 + (PN x (1 + r))
When r is 0, then the points available will just be 10/9/8/7/6/5/4/3/2/1/0. This is synonymous with the average position method.
But when r is increased to 0.1, the points become 15.9/13.6/11.4/9.5/7.7/6.1/4.6/3.3/2.1/1/0.
And when r is as high as 2, the points are 29524/9841/3280/1093/364/121/40/13/4/1/0.
As you can see, the nature of this method will lead to some very strange numbers, so the final results will be normalised by being divided by whoever finishes top of the rankings.
Let's see how the position of our Wacky Racers changes as we increase r:
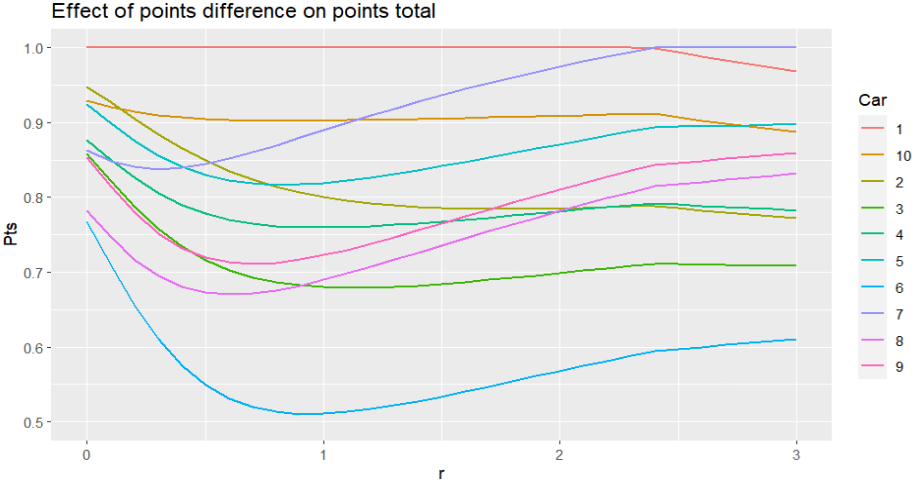
I'm sure some of you will be as annoyed as me by the order of the legend, but I can not work out how to easily fix it.
I have removed the Mean Machine (00) so the positions of the other 10 is a bit clearer.
It's interesting to see the curves of the different racers. The race at the top is initially dominated by the Slag Brothers (1, red line), who enjoy a huge lead over their second-place challengers. But eventually the Ant Hill Mob (7, purple) close the gap as the points available for race wins begins to dwarf all over values. It takes until r is 2.4 for them to eventually move up to 1st, by which stage the points for finishing second are just 29% that of winning the race, which is pretty extreme.
Similarly, it takes Penelope Pitstop until r = 2.8 to move into third, but we're still a way off the order the racers finished under Method 1. In order to match that, r has to be increased all the way up to 6:
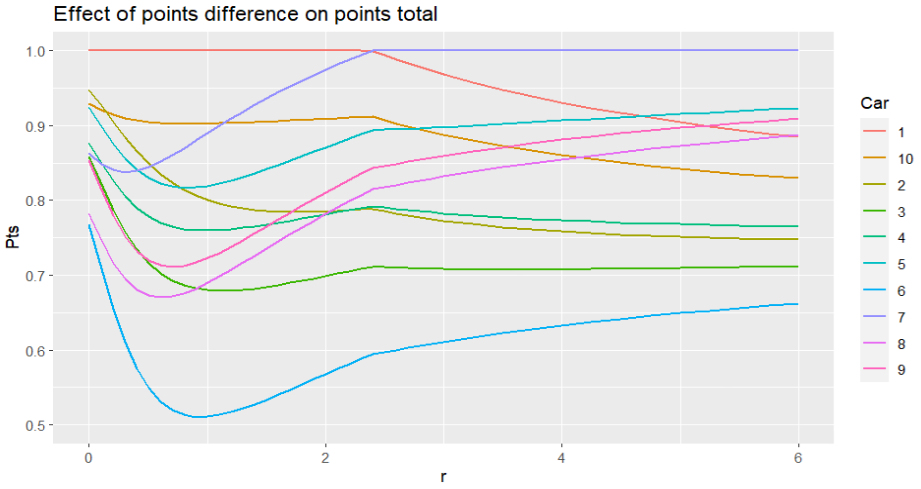
This is because we're waiting for the Arkansas Chuggabug (8, violet) to overtake the Boulder Mobile. The former's average position was the third-lowest (including the Mean Machine), but because they happened to win one race more than the Slag Brothers they are ranked ahead of them in the Olympic-style table.
When r is 6, then each position is receiving 7 times the points of that below it. So if the race winner received 1000 points, 2nd would get 143pts, 3rd would get 20pts, 4th would get 3pts. After that, you are already into fractions of a single point.
This highlights how extreme the Olympic ranking method is. So much so that I am going to investigate that in a follow-up article that I hadn't planned when I started this. But let's move onto the ultimate aim of this article:
Who is the overall Wacky Races champion?
The points system of NASCAR corresponds to an r value of 0 if we discount the bonus for the race winner. The F1 points systems don't exactly correspond to the an r value, but the old F1 system is roughly r = 0.5 and the new system is roughly r = 0.3 for 1st place and r = 0.1 for the other positions.
The AAA Championship is roughly r = 1, and that was the most extreme one I could find. The point is that the high r values used in the tables above are far beyond ranking systems used by any form of racing. Therefore, it seems a stretch to say that the Ant Hill Mob have a realistic claim to be the overall champion, and therefore I declare that the Boulder Mobile is the Wacky Racers Championship winner!

This started off as a bit of fun, but it uncovers the impact that different points systems can have on the overall results. Ultimately, it comes down to competition organisers to decide how much they want to reward the race winners.
A big reward for the race winners can create excitement in that each race gives everybody hope that winning the race can see them climb up the table, but the flip side is that every individual race doesn't have a lot riding on the positions away from the podium.
Anyway, I'll be back soon to have a look at Olympic medal tables!
Postscript: if you enjoyed the discussion of F1's points systems, Jacob Whittle wrote a guest article on this website a few years ago
 RSS Feed