by Adrian Worton
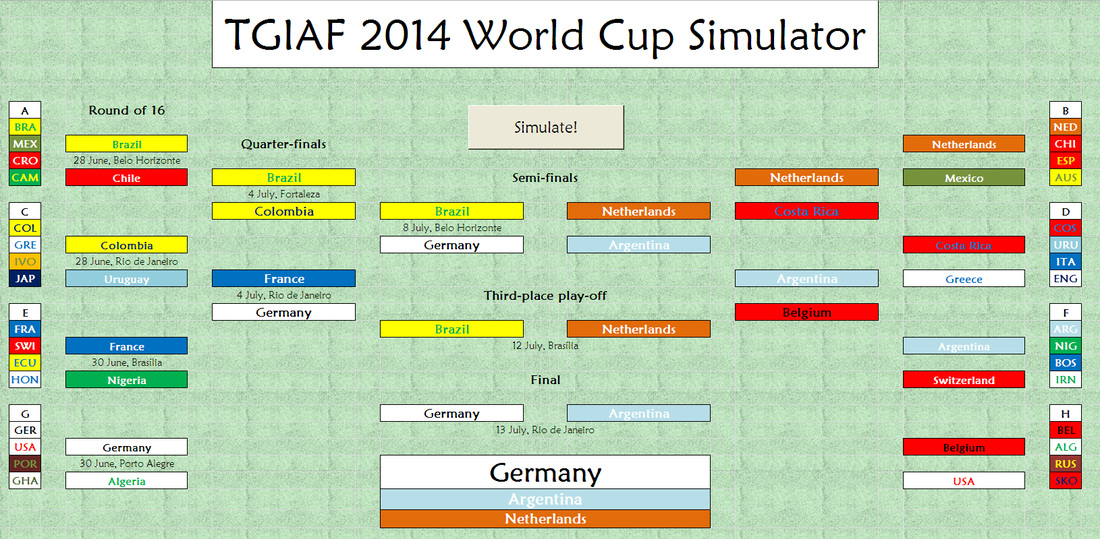
During the build-up to the World Cup, we created the TGIAF World Cup Simulator, using odds from bookmakers. There were two key mechanisms which allowed us to do this - turning pre-existing odds into probabilities, and creating our own odds for fixtures which had yet to be scheduled (i.e. the knockout fixtures.
Running the model multiple times allowed us to get an idea of the overall probabilities of certain events occurring, and allowed us to get an idea of which odds for the World Cup the bookies had underestimated, making them good value bets.
With the World Cup now over, we can now turn these multiple simulations onto our own simulator, and see if its predictions were realistic.
The perfect simulation - however, because we have dealt in probabilities, measuring the strength of the simulator is very hard to gauge.
Turning odds into probabilities
In our first article on the World Cup, we showed that for an event where every possibility is covered by odds, we can get the probabilities of each outcome using the odds. Because a football match has each of its three possible results (team 1 wins, team 2 wins, draw) covered, we managed to extend this method to the whole group stage of the World Cup, where odds already existed.
If our matches all had the same probabilities - for example, a 50% chance of Team 1 winning, a 30% chance of Team 2 winning, and a 20% chance of a draw - then there are simple statistical tests we could have undertaken to see if our method had given us accurate probabilities. However, each of our matches had a different probability for each outcome, so we have to find a different way to get an idea of how good our predictions were.
Firstly, we need to decide what we are measuring. A common way would be to separate results into "Home win", "Away win" and "Draw". However, with the exception of Brazil's matches, all games were played on neutral turf, so instead we can separate our teams by which one is favourite (where the favourite is the one with the shortest pre-match odds). Therefore, we can count the number of times the favourite won a group stage match, the number of times their opponent won, and the number of draws.
We can now run our simulator thousands of times, and count each simulation's total for these values, comparing these to the real-life results.
Use the slideshow below to see these results. The lines show the distribution of each type of result for our simulator, whilst the yellow column shows the real-life outcome. If our predicition are accurate then the real-life results should be within the centre of our distributions. If it is poor then the yellow column will be around the edges of the distribution.
We can see that real-life results have matched our predictions almost perfectly. If one real-life underdog victory had turned into a win for the favourites then it would have been a perfect match.
It is hugely encouraging to see that this mechanism, which is the underlying part of the whole simulator, has reflected real-life so well.
Creating odds
For the knockout fixtures we could not just take probabilities from bookmakers and turn them into probabilities, since the fixtures had yet to be drawn. Therefore, we needed a robust method of calculating odds for any match-up of two sides in the tournament. This was achieved by using each team's overall probability of winning the tournament as a measure of their strength.
We can compare the real-life odds the bookmakers gave to each knockout fixture with the odds our model gives using the coefficient (measure of strength) taking odds from the following time points:
- T0 - The start of the tournament
- T1 - After the group stages
- T2 - Before the quarter-finals
- T3 - Before the semi-finals
- T4 - Before the final
We can see that for the second round our models perform well, with only one significant outlier, where our T0 model predicted the odds for the biggest underdog of the round, Algeria, winning as being far higher than they actually were.
Similarly, for the quarter-finals the only major outliers were from the biggest underdog in the round, Costa Rica, winning, although in this case our "updated" model (T2) underestimated their odds.
The effect of seeing odds for underdogs winning being too high in our T0 model is not a huge surprise, the fact that they have got through to the later stages would mean that their overall ability had been underestimated by the bookies at the start of the tournament, and therefore the coefficient we have used to create their odds is similarly ill-measured.
For the final four matches our model doesn't predict the odds as well. This is also not a huge surprise, as the model was trained on data for group stage matches, so the relationship between a team's coefficient and their odds of winning a match is likely to be different for later matches.
Overall, however, our model has performed well, with a minimal amount of odds which are significantly different to the actual odds given by the bookies.
Recommended bets
In the creation of our model, we highlighted a number of odds available where the bookmakers seemed to have underestimated the strength of a team winning, meaning that these bets might be good value for money.
Firstly, in the group stage there were two bets identified as being good value:
Additionally, we looked at the 'stage of elimination' odds to see if there were any which seemed good value. None of the odds for teams to get eliminated in the group stage were good value at all.
For the second round nearly every team seemed good value. The ones in particular were Algeria (5/1), Cameroon (4/1), Ecuador (19/10), Ghana (9/2), Greece (11/4), Iran (11/2), Mexico (21/10), Nigeria (11/4) and Switzerland (9/5). £10 placed on each of these outcomes would being a return of £54, thanks to Algeria, Greece, Mexico, Nigeria and Switzerland all falling at this hurdle.
Again, virtually every team seemed good value, in particular Belgium (100/30), Italy (5/2), Nigeria (11/4) and Uruguay (3/1). £10 placed on all three teams would have brought a small loss of £6.67, with Belgium's loss to Argentina outweighed by the three other sides already being knocked out.
In the semi-final stage the teams which seemed best value for money were Colombia (10/1), France (6/1), Netherlands (9/1), Spain (9/2) and Uruguay (10/1). £10 on each side here would bring back a return of £40, due to the Dutch defeat to Argentina.
For the odds of being a runner-up, the "Big Four" teams (Argentina (11/2), Brazil (6/1), Germany (7/1), Spain(7/1)) all appeared good value for money, along with Italy (18/1). £10 placed on these fives teams would make a profit of £5, thanks to Argentina.
And, finally, for the odds to win the tournament outright, the clear good-value teams were Argentina (4/1), Germany (6/1) and Spain (6/1). £10 placed on these three would bring back a return of £30.
Therefore, following our recommended bets would have brought back £192.33.
Conclusion
We have seen that the basic mechanisms of our model performed very well in the tournament, with the real-life number of favourite victories, underdog victories and draws falling in the middle of our prediction range.
Our method for creating odds was less effective as the tournament wore on, although it still performed reasonably well, particularly given its simplicity.
But most importantly, our model allowed us to make recommended bets which would have brought back huge profits for anyone brave enough to trust us.
Similarly, for the quarter-finals the only major outliers were from the biggest underdog in the round, Costa Rica, winning, although in this case our "updated" model (T2) underestimated their odds.
The effect of seeing odds for underdogs winning being too high in our T0 model is not a huge surprise, the fact that they have got through to the later stages would mean that their overall ability had been underestimated by the bookies at the start of the tournament, and therefore the coefficient we have used to create their odds is similarly ill-measured.
For the final four matches our model doesn't predict the odds as well. This is also not a huge surprise, as the model was trained on data for group stage matches, so the relationship between a team's coefficient and their odds of winning a match is likely to be different for later matches.
Overall, however, our model has performed well, with a minimal amount of odds which are significantly different to the actual odds given by the bookies.
Recommended bets
In the creation of our model, we highlighted a number of odds available where the bookmakers seemed to have underestimated the strength of a team winning, meaning that these bets might be good value for money.
Firstly, in the group stage there were two bets identified as being good value:
- Croatia to beat Brazil (at 9/1)
- Costa Rica to beat Uruguay (at 9/1)
Additionally, we looked at the 'stage of elimination' odds to see if there were any which seemed good value. None of the odds for teams to get eliminated in the group stage were good value at all.
For the second round nearly every team seemed good value. The ones in particular were Algeria (5/1), Cameroon (4/1), Ecuador (19/10), Ghana (9/2), Greece (11/4), Iran (11/2), Mexico (21/10), Nigeria (11/4) and Switzerland (9/5). £10 placed on each of these outcomes would being a return of £54, thanks to Algeria, Greece, Mexico, Nigeria and Switzerland all falling at this hurdle.
Again, virtually every team seemed good value, in particular Belgium (100/30), Italy (5/2), Nigeria (11/4) and Uruguay (3/1). £10 placed on all three teams would have brought a small loss of £6.67, with Belgium's loss to Argentina outweighed by the three other sides already being knocked out.
In the semi-final stage the teams which seemed best value for money were Colombia (10/1), France (6/1), Netherlands (9/1), Spain (9/2) and Uruguay (10/1). £10 on each side here would bring back a return of £40, due to the Dutch defeat to Argentina.
For the odds of being a runner-up, the "Big Four" teams (Argentina (11/2), Brazil (6/1), Germany (7/1), Spain(7/1)) all appeared good value for money, along with Italy (18/1). £10 placed on these fives teams would make a profit of £5, thanks to Argentina.
And, finally, for the odds to win the tournament outright, the clear good-value teams were Argentina (4/1), Germany (6/1) and Spain (6/1). £10 placed on these three would bring back a return of £30.
Therefore, following our recommended bets would have brought back £192.33.
Conclusion
We have seen that the basic mechanisms of our model performed very well in the tournament, with the real-life number of favourite victories, underdog victories and draws falling in the middle of our prediction range.
Our method for creating odds was less effective as the tournament wore on, although it still performed reasonably well, particularly given its simplicity.
But most importantly, our model allowed us to make recommended bets which would have brought back huge profits for anyone brave enough to trust us.
 RSS Feed