by Dr Adrian Worton
In our article earlier this week we introduced expected goals (xG or xGoals), a statistic which tells us how good a chance is. We can use this to see how well teams "deserve" to do, for instance whether a certain team is overachieving. We have also used it to calculate the likelihood that a team wins a particular match, given the chances that each side had.
In this article, we are going to use these stats to assess how the 12 SPL teams are faring up so far. This will hopefully be informative in that we can see who is shaping up to have a good/bad season, but also will be a neat way of demonstrating how effective these statistics can be.
So without further ado, let's go through the teams! Click each side's name below to bring up their analysis. You will find a table detailing their matches thus far, including both the real result and how they performed under our xG model. Additionally, you will find maps for shots they have both taken and faced - click on the thumbnails to view full-size.
Aberdeen
Match |
Real result |
xG For |
xG Against |
P(win) |
P(draw) |
P(loss) |
Hamilton (H) |
Won 2-0 |
3.01 |
0.40 |
94.2% |
4.9% |
0.9% |
Ross County (A) |
Won 2-1 |
3.08 |
0.60 |
92.5% |
6.3% |
1.2% |
Dundee (H) |
Won 2-1 |
1.43 |
1.55 |
33.0% |
27.0% |
40.0% |
Partick Thistle (A) |
Won 4-3 |
2.95 |
1.05 |
81.7% |
12.8% |
5.5% |
4 wins from 4, top of the table - things are going well for Aberdeen, who will want to secure another top-two position and close the gap on Celtic this season.
Looking at the table above, three of their wins have been secured comprehensively, with the only exception being the win against Dundee, which could have gone either way, and was more likely to go to Dundee.
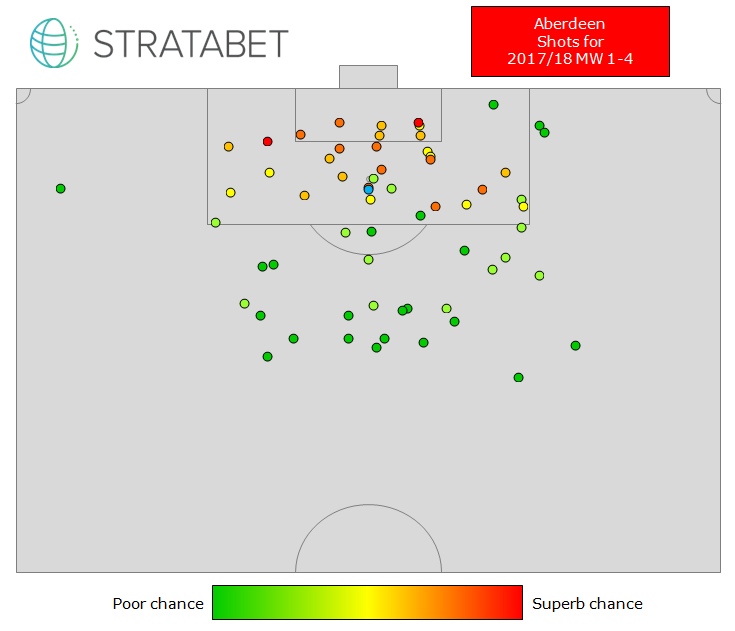
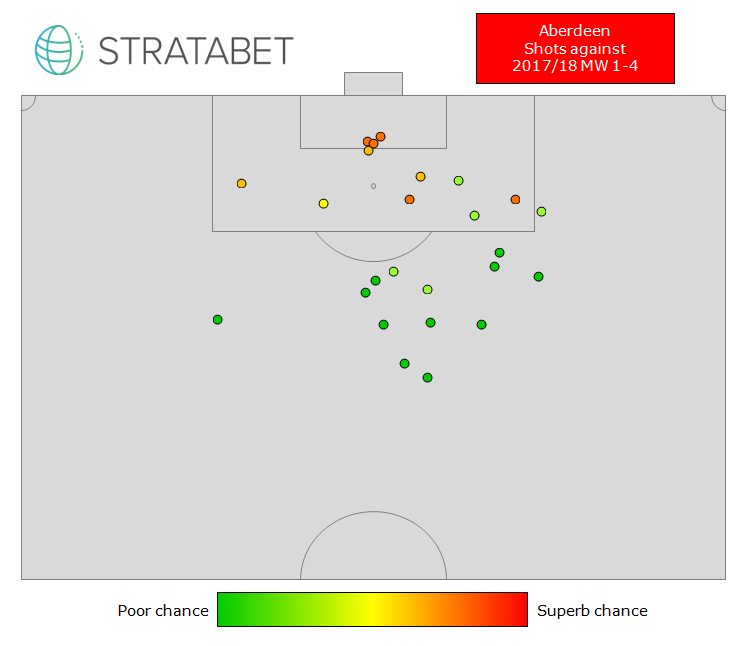
In terms of scoring goals, Aberdeen have scored 10 and have an xG of 10.47. This means they are creating a lot, and they are finishing well. At the other end things look good as well, with an xG against of 3.60 meaning they possibly have been a bit unlucky to concede 5 goals thus far.
Looking at Aberdeen's shot maps below, we can see that they have been creating good-quality chances inside the box, although they may be worried by the cluster of chances they are conceding within their own 6-yard box.
Looking at the table above, three of their wins have been secured comprehensively, with the only exception being the win against Dundee, which could have gone either way, and was more likely to go to Dundee.
In terms of scoring goals, Aberdeen have scored 10 and have an xG of 10.47. This means they are creating a lot, and they are finishing well. At the other end things look good as well, with an xG against of 3.60 meaning they possibly have been a bit unlucky to concede 5 goals thus far.
Looking at Aberdeen's shot maps below, we can see that they have been creating good-quality chances inside the box, although they may be worried by the cluster of chances they are conceding within their own 6-yard box.
Celtic
Match |
Real result |
xG For |
xG Against |
P(win) |
P(draw) |
P(loss) |
Hearts (H) |
Won 4-1 |
3.20 |
0.20 |
97.6% |
2.2% |
0.2% |
Partick Thistle (A) |
Won 1-0 |
1.02 |
0.56 |
45.1% |
35.3% |
19.5% |
Kilmarnock (A) |
Won 2-0 |
1.75 |
0.23 |
80.3% |
16.5% |
3.2% |
St. Johnstone (H) |
Drew 1-1 |
3.04 |
1.14 |
78.5% |
13.7% |
7.8% |
Unbeaten domestically last season, Celtic's fans will be expecting the same level of domination this year. They started excellently, beating Hearts soundly, following up with two decent wins and a draw with St. Johnstone.
Looking at the table above, it's clear that Celtic are worth their results so far. They only just scraped a win against Partick, but in each of their other games they have comfortably outperformed their opponents. Their draw against St. Johnstone should have been a win, particularly given Celtic's xG for.
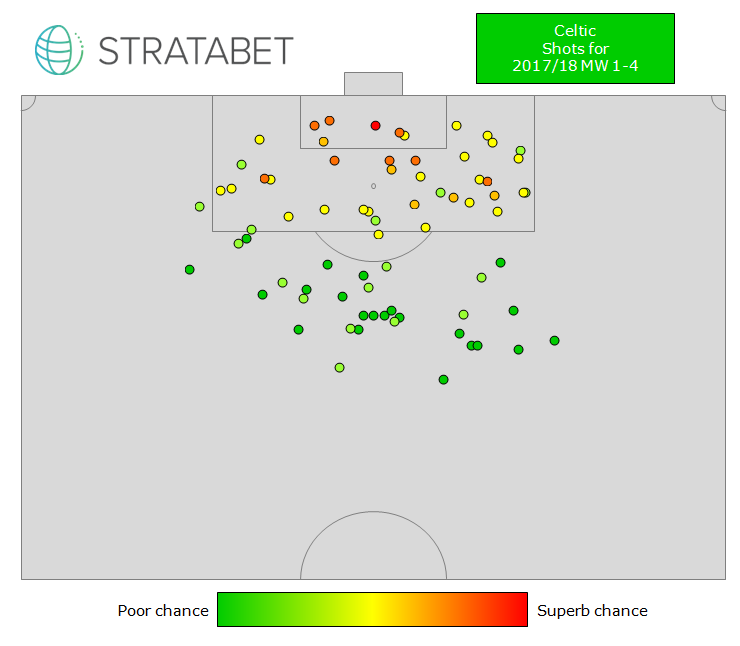
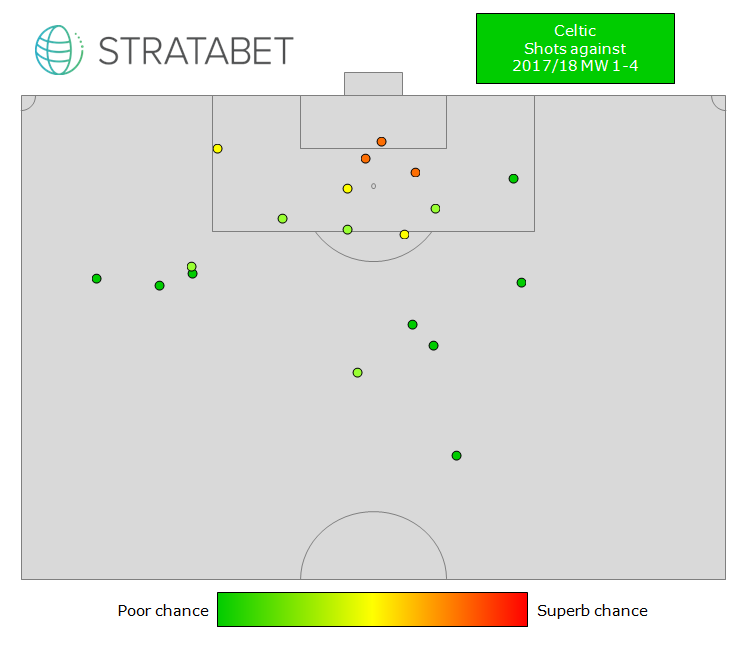
The side's main strength has been in defence, where an average of 0.53 xG against demonstrates how resolute Celtic are at the back. Up front an average of 2.25 is good, although given Celtic's superiority over the rest of the league, it could be higher.
Looking at the shot maps below, Celtic are adept at getting decent-quality shots from just inside the box away. The map of shots against them shows how difficult their opponents have found it, with very few shots taken at all.
Looking at the table above, it's clear that Celtic are worth their results so far. They only just scraped a win against Partick, but in each of their other games they have comfortably outperformed their opponents. Their draw against St. Johnstone should have been a win, particularly given Celtic's xG for.
The side's main strength has been in defence, where an average of 0.53 xG against demonstrates how resolute Celtic are at the back. Up front an average of 2.25 is good, although given Celtic's superiority over the rest of the league, it could be higher.
Looking at the shot maps below, Celtic are adept at getting decent-quality shots from just inside the box away. The map of shots against them shows how difficult their opponents have found it, with very few shots taken at all.
Dundee
Match |
Real result |
xG For |
xG Against |
P(win) |
P(draw) |
P(loss) |
Ross County (H) |
Lost 2-1 |
1.49 |
1.66 |
32.6% |
26.6% |
40.8% |
Hamilton (A) |
Lost 3-0 |
2.56 |
1.87 |
55.2% |
22.8% |
22.0% |
Aberdeen (A) |
Lost 2-1 |
1.55 |
1.43 |
40.0% |
27.0% |
33.0% |
Hibernian (H) |
Drew 1-1 |
1.18 |
2.25 |
15.1% |
22.0% |
62.8% |
Dundee avoided the relegation play-offs last year by 2 points. With that in mind, they would probably settle for a season clear of relegation trouble this year. However, a poor start returning just one point doesn't bring much evidence of things changing.
However, looking at the side's expected performances thus far, they have been somewhat unlucky, with solid chances of winning all four games. Unexpectedly, Dundee's best performance is in the 3-0 defeat they suffered to Hamilton, whilst their draw with Hibernian saw their lowest xG for and likelihood of victory.
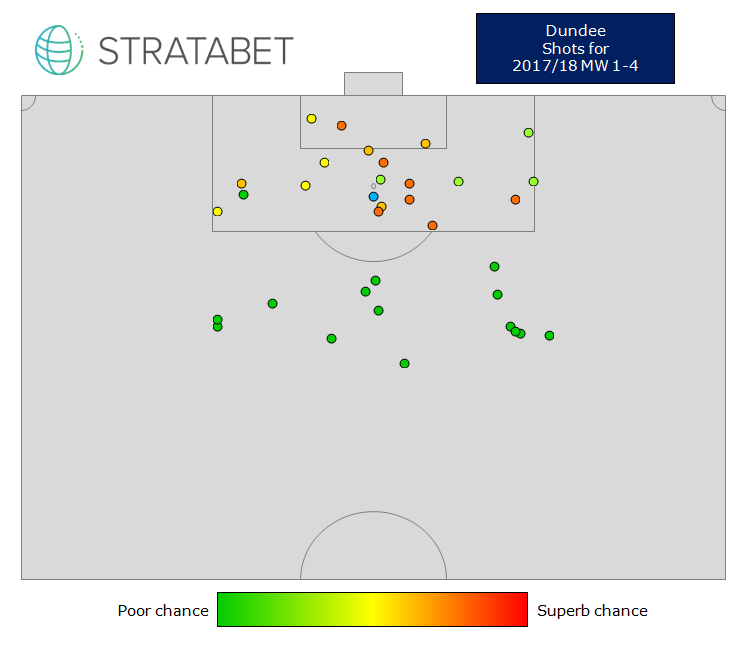
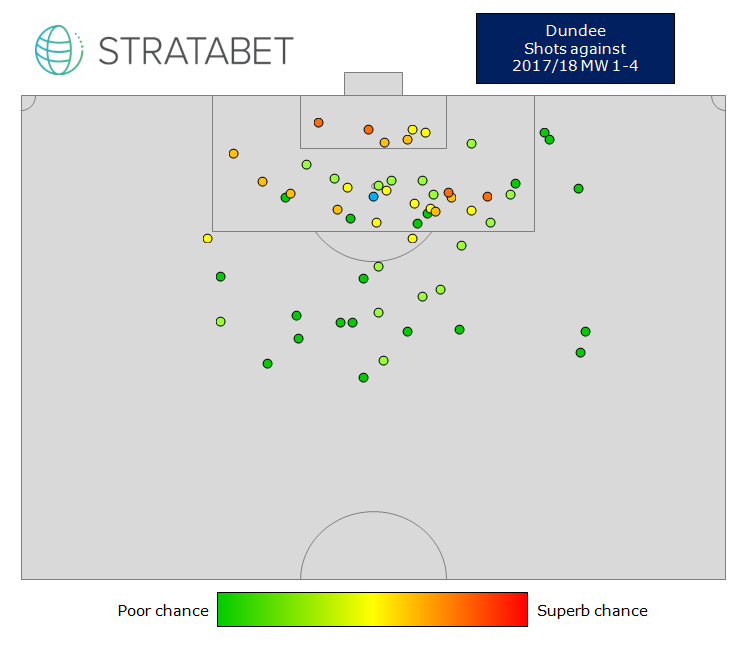
In total, Dundee's xG is 6.78, but with only 3 goals scored, they will be hoping their strikers can improve on their chances they have had. At the other end, they have marginally been conceding more than expected (8 goals versus an xG of 7.21). So overall, there's not that much wrong with the side really - they just need a better rub of the green.
Dundee's shot maps shot that their opponents have taken a lot of unlikely long efforts, whilst Dundee have been creating chances closer to goal. This is an encouraging sign, and with better finishing there should be an improvement soon.
However, looking at the side's expected performances thus far, they have been somewhat unlucky, with solid chances of winning all four games. Unexpectedly, Dundee's best performance is in the 3-0 defeat they suffered to Hamilton, whilst their draw with Hibernian saw their lowest xG for and likelihood of victory.
In total, Dundee's xG is 6.78, but with only 3 goals scored, they will be hoping their strikers can improve on their chances they have had. At the other end, they have marginally been conceding more than expected (8 goals versus an xG of 7.21). So overall, there's not that much wrong with the side really - they just need a better rub of the green.
Dundee's shot maps shot that their opponents have taken a lot of unlikely long efforts, whilst Dundee have been creating chances closer to goal. This is an encouraging sign, and with better finishing there should be an improvement soon.
Hamilton Academical
Match |
Real result |
xG For |
xG Against |
P(win) |
P(draw) |
P(loss) |
Aberdeen (A) |
Lost 2-0 |
0.40 |
3.01 |
0.9% |
4.9% |
94.2% |
Dundee (H) |
Won 3-0 |
1.87 |
2.56 |
22.0% |
22.8% |
55.2% |
Hibernian (A) |
Won 3-1 |
2.47 |
1.55 |
60.4% |
28.6% |
19.0% |
Kilmarnock (A) |
Drew 2-2 |
1.54 |
0.90 |
53.6% |
28.6% |
17.8% |
Hamilton survived last year thanks to a play-off win over the Championship's Dundee United. Therefore, 7 points from 4 matches is a welcome return from the opening matches of this season.
The solitary defeat, away to Aberdeen, was embarrassingly one-sided, whilst any win against Dundee was fairly unlikely, let alone a 3-0 triumph. The win over Hibs was much better and well-deserved, and Hamilton were the better side in their draw with Kilmarnock.
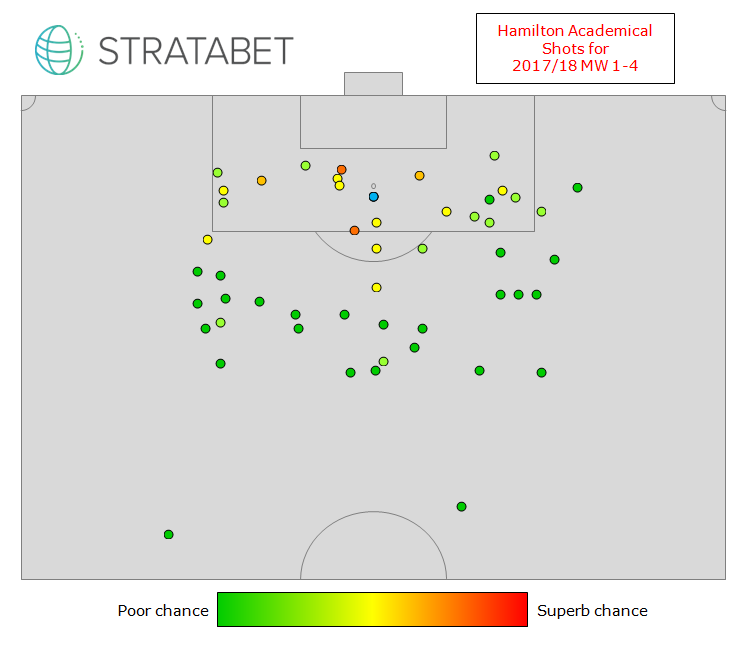
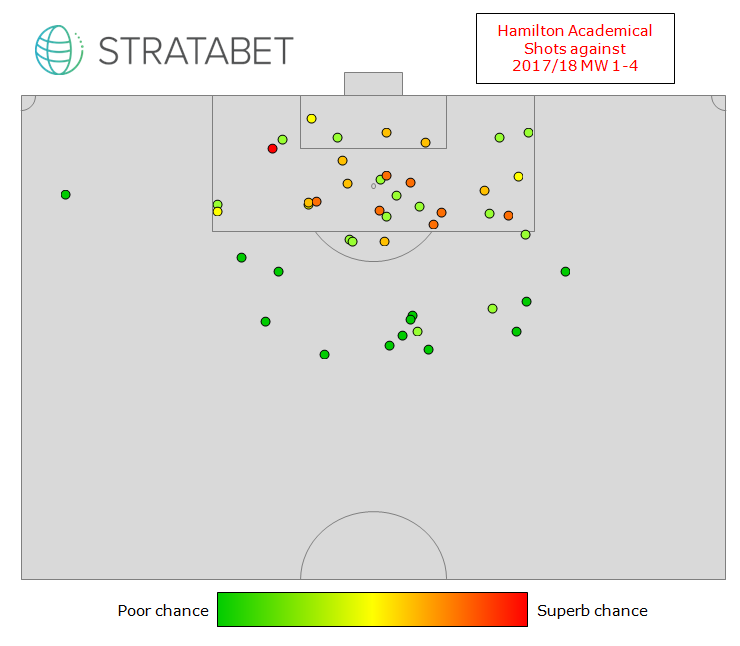
An xG for tally of 6.28 is healthy, and with 8 goals scored it can be taken as a sign that their strikers are in good form, although it also probably contributes to a sense that Hamilton are slightly getting the rub of the green.
Their shot for map shows that their players are happy to let fly from distance, which isn't a particularly good way to score goals, but it has been working so far. They may be concerned with the number of chances they are conceding in their own box, but so far they look capable of avoiding a relegation fight this year.
The solitary defeat, away to Aberdeen, was embarrassingly one-sided, whilst any win against Dundee was fairly unlikely, let alone a 3-0 triumph. The win over Hibs was much better and well-deserved, and Hamilton were the better side in their draw with Kilmarnock.
An xG for tally of 6.28 is healthy, and with 8 goals scored it can be taken as a sign that their strikers are in good form, although it also probably contributes to a sense that Hamilton are slightly getting the rub of the green.
Their shot for map shows that their players are happy to let fly from distance, which isn't a particularly good way to score goals, but it has been working so far. They may be concerned with the number of chances they are conceding in their own box, but so far they look capable of avoiding a relegation fight this year.
Hearts
Match |
Real result |
xG For |
xG Against |
P(win) |
P(draw) |
P(loss) |
Celtic (A) |
Lost 4-1 |
0.20 |
3.20 |
0.2% |
2.2% |
97.6% |
Kilmarnock (A) |
Won 1-0 |
1.62 |
0.68 |
63.1% |
25.0% |
11.9% |
Rangers (A) |
Drew 0-0 |
0.44 |
2.22 |
3.6% |
12.6% |
83.8% |
Motherwell (A) |
Lost 2-1 |
0.50 |
1.34 |
11.4% |
26.4% |
62.2% |
Last season Hearts finished one place away from Europe, and so this year they should be aiming to challenge for a lucrative top-four space. However, their start this season has yet to promise much, with 4 points from 4.
The defeat to Celtic is the most one-sided of the league so far, whilst their loss against Motherwell was similarly well-deserved. Even their draw with Rangers should really have seen a defeat, with a 83.8% chance of a Rangers victory. Their win over Kilmarnock was good, but their overall level clearly needs to improve.
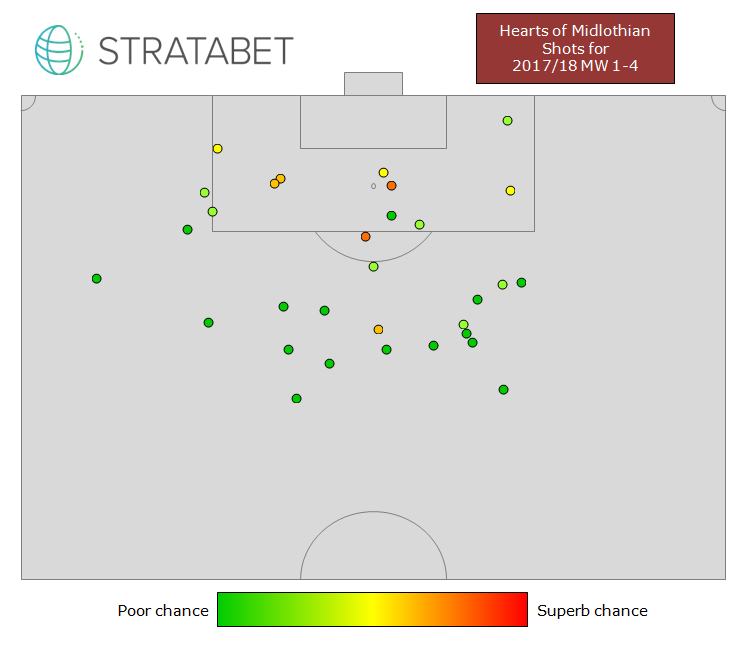
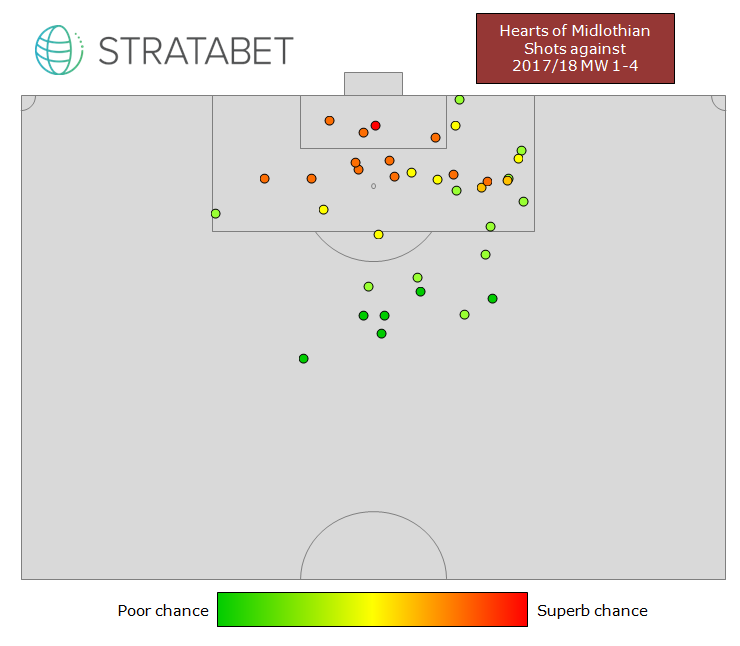
It's clear that Hearts' main issue is going forwards, with an average xG of 0.69 being worryingly low and the main cause of their low win likelihoods. At the back, the Celtic match aside, they are looking fairly solid.
Hearts' shots for map shows why they are struggling to score - they are failing to create any chances of quality, with very few inside the box, and only a couple of reasonably quality. Compared to the quality and location of chances they are conceding, and there are issues at both ends of the pitch for Hearts to fix.
The defeat to Celtic is the most one-sided of the league so far, whilst their loss against Motherwell was similarly well-deserved. Even their draw with Rangers should really have seen a defeat, with a 83.8% chance of a Rangers victory. Their win over Kilmarnock was good, but their overall level clearly needs to improve.
It's clear that Hearts' main issue is going forwards, with an average xG of 0.69 being worryingly low and the main cause of their low win likelihoods. At the back, the Celtic match aside, they are looking fairly solid.
Hearts' shots for map shows why they are struggling to score - they are failing to create any chances of quality, with very few inside the box, and only a couple of reasonably quality. Compared to the quality and location of chances they are conceding, and there are issues at both ends of the pitch for Hearts to fix.
Hibernian
Match |
Real result |
xG For |
xG Against |
P(win) |
P(draw) |
P(loss) |
Partick Thistle (H) |
Won 3-1 |
2.67 |
0.87 |
81.2% |
13.0% |
5.8% |
Rangers (A) |
Won 3-2 |
1.19 |
1.64 |
24.9% |
26.6% |
48.5% |
Hamilton (H) |
Lost 3-1 |
1.55 |
2.47 |
19.0% |
20.6% |
60.4% |
Dundee (A) |
Drew 1-1 |
2.25 |
1.18 |
62.8% |
22.0% |
15.1% |
Hibs are this year's new boys, as the runaway winners of the Championship. Often, newly-promoted teams mainly just aim to survive in their first year up, but a team with Hibs' resources (for example, they have the highest attendances outside of the Old Firm) may reasonably expect a little more. Seven points isn't a bad way to start the campaign, particularly the two opening wins.
Their win over Partick was particularly impressive and well-deserved. The victory over Rangers was a dramatic match, and won slightly against the win likelihood. There was no such luck against Hamilton, where they suffered a defeat that was merited, before being the better of the two sides in a draw with struggling Dundee.
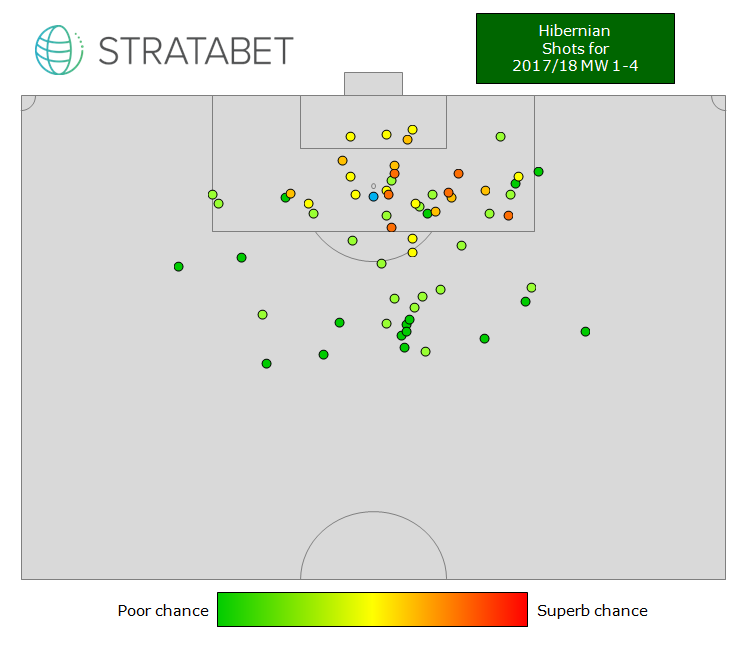
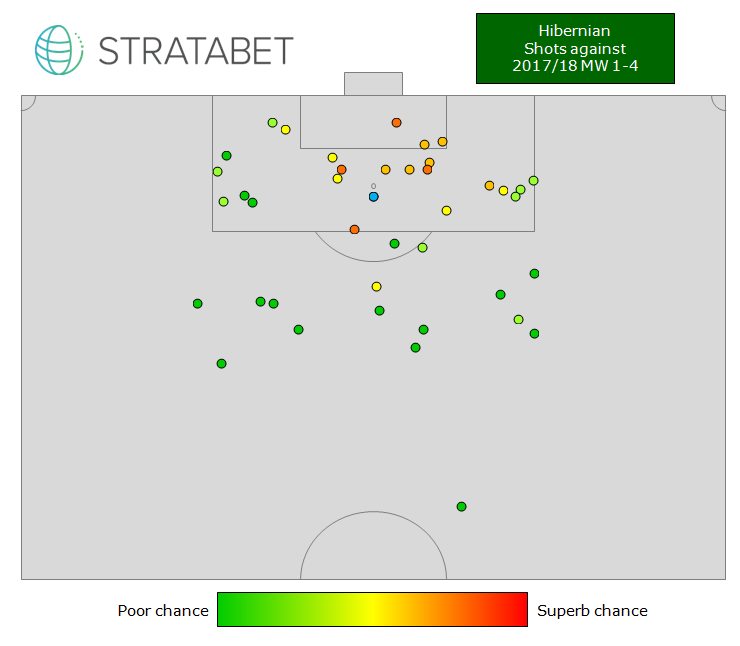
Hibs' xG for is a healthy 7.66, and they have scored 8, which suggests they are creating plenty of chances and finishing well. At the back their xG conceded is 6.16, and they have conceded 7. So overall, Hibs are roughly getting the luck they've earned. And it seems they are a pretty exciting team to watch.
Their shot for map shows a side which is certainly isn't afraid to shoot from range. However, there are in fact chances from all sorts of positions, demonstrating how potent this side is. They have faced fewer shots against them, but a cause for concern will be the quality of chances their opponents are creating in the middle of the box. Overall though, this is a positive start from Hibs.
Their win over Partick was particularly impressive and well-deserved. The victory over Rangers was a dramatic match, and won slightly against the win likelihood. There was no such luck against Hamilton, where they suffered a defeat that was merited, before being the better of the two sides in a draw with struggling Dundee.
Hibs' xG for is a healthy 7.66, and they have scored 8, which suggests they are creating plenty of chances and finishing well. At the back their xG conceded is 6.16, and they have conceded 7. So overall, Hibs are roughly getting the luck they've earned. And it seems they are a pretty exciting team to watch.
Their shot for map shows a side which is certainly isn't afraid to shoot from range. However, there are in fact chances from all sorts of positions, demonstrating how potent this side is. They have faced fewer shots against them, but a cause for concern will be the quality of chances their opponents are creating in the middle of the box. Overall though, this is a positive start from Hibs.
Kilmarnock
Match |
Real result |
xG For |
xG Against |
P(win) |
P(draw) |
P(loss) |
St. Johnstone (H) |
Lost 2-1 |
1.11 |
0.98 |
38.2% |
31.4% |
30.5% |
Hearts (H) |
Lost 1-0 |
0.68 |
1.62 |
11.9% |
25.0% |
63.1% |
Celtic (H) |
Lost 2-0 |
0.23 |
1.75 |
3.2% |
16.5% |
80.3% |
Hamilton (H) |
Drew 2-2 |
0.90 |
1.54 |
17.8% |
28.6% |
53.6% |
Mid-table last year, Kilmarnock would probably hope for a similar season this year. However, starting the season with three defeats and a draw isn't a great start. Particularly because, due to a quirk of scheduling, Kilmarnock have played every game at home so far.
The losses to Hearts and Celtic were meek, with their probability of victory very small. Additionally, their solitary point, earned against Hamilton, probably should have been a defeat, given the chances they conceded. On the plus side, their opening-day defeat to St. Johnstone was their best performance thus far, and really they ought to have taken something from that match.
Kilmarnock's 3 goals scored is the joint-lowest in the league thus far, and an xG for of 2.92 is similarly paltry. Worryingly, their xG against is 5.89 - more than double their xG for.
Looking at their shot maps, it's clear that Kilmarnock are getting few shots away. Furthermore, a large proportion of those are low-quality chances. At the other end they are facing a lot of efforts, although a large chunk of these are from far out (probably against Hamilton). Much improvement is needed for Kilmarnock to avoid getting dragged into a relegation battle. In fact, they are currently favourites with the bookmakers to go down.


Motherwell
Match |
Real result |
xG For |
xG Against |
P(win) |
P(draw) |
P(loss) |
Rangers (H) |
Lost 2-1 |
1.99 |
2.27 |
32.3% |
23.6% |
44.1% |
St. Johnstone (A) |
Lost 4-1 |
1.69 |
2.31 |
23.4% |
23.1% |
53.5% |
Ross County (H) |
Won 2-0 |
1.72 |
1.08 |
54.7% |
26.4% |
18.9% |
Hearts (H) |
Won 2-1 |
1.34 |
0.50 |
62.2% |
26.4% |
11.4% |
Motherwell are another team who weren't far from the relegation spaces last year. So far this year they have two wins and two defeats, which is a reasonable start.
The heavy nature of their loss to St. Johnstone was harsh, as it was a fairly well-matched game, although like their defeat to Rangers, Motherwell would have been very lucky to win. On the flip side, their two wins have been impressive, with solid win likelihoods against Ross County and Hearts.
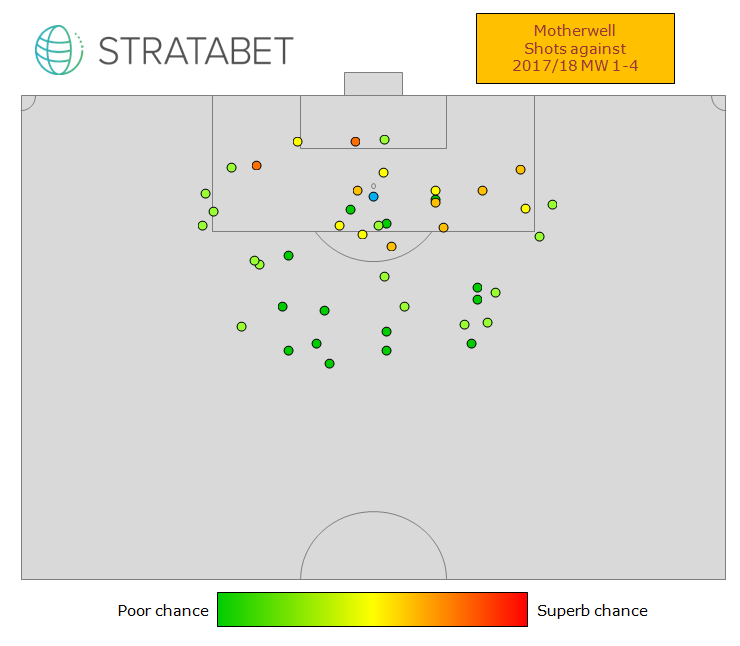
Having xG against of over 2 in the opening games may be a cause for concern, but Motherwell have recovered well in defence, particularly how they restricted Hearts to an xG of 0.50. Up front Motherwell look potent, with their xG for consistently closer to 2 than 1.
Their shot map shows a side which isn't taking loads of shots, but importantly they are creating plenty of good-quality chances. At the back they appear reasonably secure, with only four shots taken closer than 12 yards in. Overall, this is an encouraging start for Motherwell.
The heavy nature of their loss to St. Johnstone was harsh, as it was a fairly well-matched game, although like their defeat to Rangers, Motherwell would have been very lucky to win. On the flip side, their two wins have been impressive, with solid win likelihoods against Ross County and Hearts.
Having xG against of over 2 in the opening games may be a cause for concern, but Motherwell have recovered well in defence, particularly how they restricted Hearts to an xG of 0.50. Up front Motherwell look potent, with their xG for consistently closer to 2 than 1.
Their shot map shows a side which isn't taking loads of shots, but importantly they are creating plenty of good-quality chances. At the back they appear reasonably secure, with only four shots taken closer than 12 yards in. Overall, this is an encouraging start for Motherwell.

Partick Thistle
Match |
Real result |
xG For |
xG Against |
P(win) |
P(draw) |
P(loss) |
Hibernian (A) |
Lost 3-1 |
0.87 |
2.67 |
5.8% |
13.0% |
81.2% |
Celtic (H) |
Lost 1-0 |
0.56 |
1.02 |
19.5% |
35.3% |
45.1% |
St. Johnstone (A) |
Lost 1-0 |
0.24 |
1.15 |
6.6% |
29.0% |
64.4% |
Aberdeen (H) |
Lost 4-3 |
1.05 |
2.95 |
5.5% |
12.8% |
81.7% |
Partick managed to get into the top 6 last season at the time of the split, meaning they guaranteed a top-half finish. Their results so far this season suggest that they are a long way off doing that again this year, yet to collect a point.
Looking at the probabilities of winning or drawing in their match and it doesn't look any rosier. Defeats to Hibernian, St. Johnstone and Aberdeen were firmly deserved. Their best performance was in their narrow defeat to Celtic, where restricting their opponents to an xG of 1.02 can be considered a success - as Celtic's table above shows, this is the best defensive performance against the defending champions.
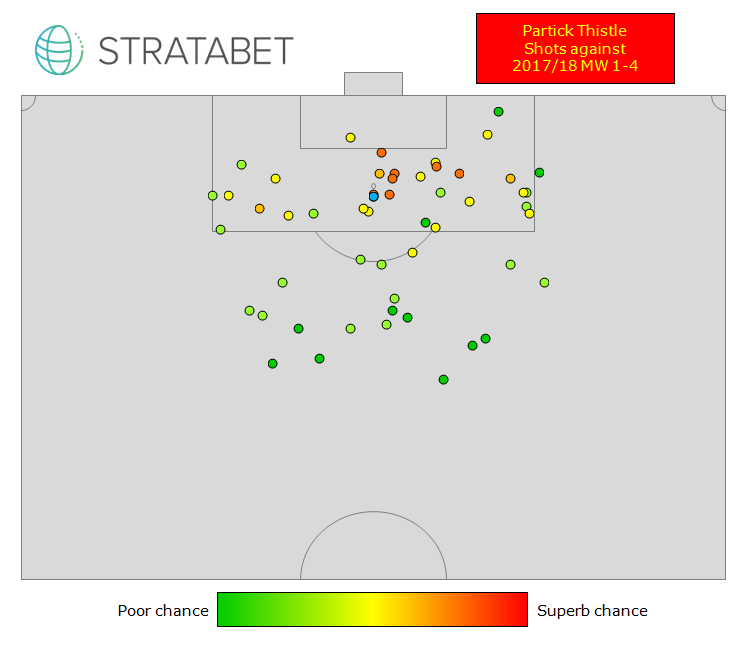
At the back an average xG against of 1.95 isn't terrible. However, there are real issues going forwards, as an average xG for of 0.68 isn't very encouraging. Even in the Aberdeen match where they scored thrice, they only created chances good enough to merit 1.05 goals.
This is summed up by their sparse shot map. The positive is the three high-quality chances in the opposition 6-yard box Partick have created, but overall there appears to be a worrying lack of creativity. At the back they are conceding a lot of chances, although plenty of these are of a low quality. The one mitigation for Partick is that all four matches have been against sides that one would expect to finish in the top half come the end of the season.
Looking at the probabilities of winning or drawing in their match and it doesn't look any rosier. Defeats to Hibernian, St. Johnstone and Aberdeen were firmly deserved. Their best performance was in their narrow defeat to Celtic, where restricting their opponents to an xG of 1.02 can be considered a success - as Celtic's table above shows, this is the best defensive performance against the defending champions.
At the back an average xG against of 1.95 isn't terrible. However, there are real issues going forwards, as an average xG for of 0.68 isn't very encouraging. Even in the Aberdeen match where they scored thrice, they only created chances good enough to merit 1.05 goals.
This is summed up by their sparse shot map. The positive is the three high-quality chances in the opposition 6-yard box Partick have created, but overall there appears to be a worrying lack of creativity. At the back they are conceding a lot of chances, although plenty of these are of a low quality. The one mitigation for Partick is that all four matches have been against sides that one would expect to finish in the top half come the end of the season.

Rangers
Match |
Real result |
xG For |
xG Against |
P(win) |
P(draw) |
P(loss) |
Motherwell (A) |
Won 2-1 |
2.27 |
1.99 |
44.1% |
23.6% |
32.3% |
Hibernian (H) |
Lost 3-2 |
1.64 |
1.19 |
48.5% |
26.6% |
24.9% |
Hearts (H) |
Drew 0-0 |
2.22 |
0.44 |
83.8% |
12.6% |
3.6% |
Ross County (A) |
Won 3-1 |
2.18 |
0.83 |
74.5% |
18.3% |
7.2% |
Last season Rangers finished third, and there was slight disappointment they were unable to challenge Aberdeen for second. This season they've had a mixed start, but 7 points isn't a disaster by any means.
Looking at all four of their games, the good news for Rangers is that they won all four matches they have played so far on xG. In fact, their draw with Hearts was a hugely one-sided affair, and the real result in this game is in fact the least likely outcome of any match played thus far this season.
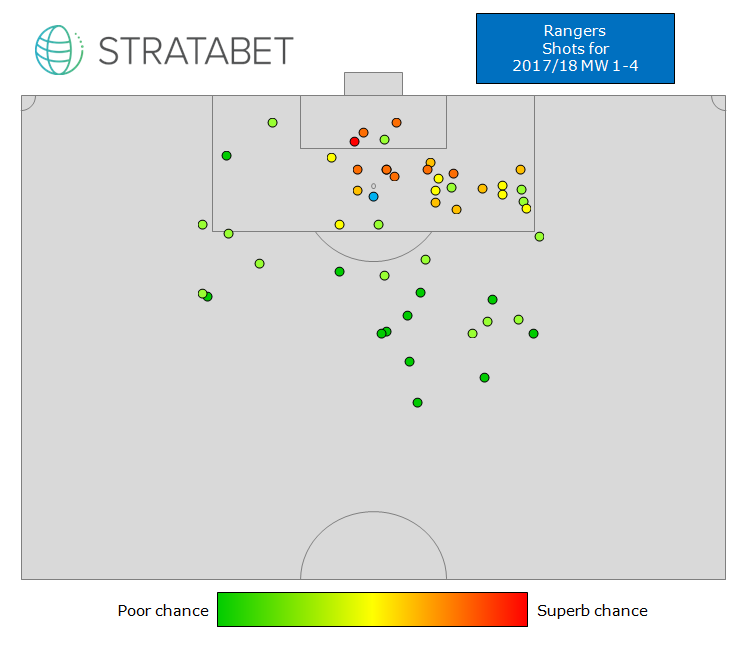
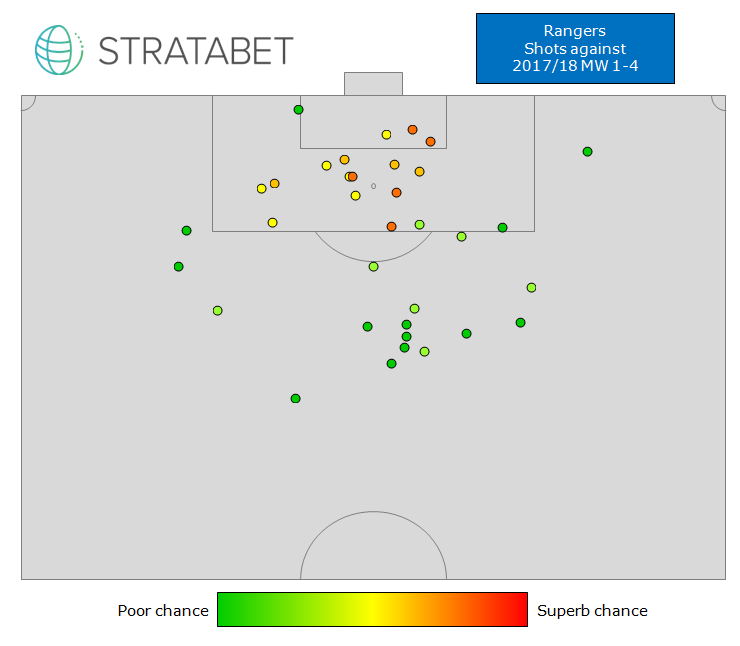
It is only in the aforementioned Hearts game where Rangers have failed to score the goals that would be expected, generally their finishing has kept up with the chances they have created. At the back they were unlucky to concede three against Hibs, but again they are performing close to their xG values. Their xG for of 8.31 is nicely high, but a xG against of 4.45 is slightly on the high side for a team of Rangers' stature.
Rangers have been pretty smart with their shooting, with not too many wasteful long shots, and plenty of good chances inside the area. Their concern at the back will be the quality of the chances they are conceding in the box, but if they can improve there they should be in good shape for the season.
Looking at all four of their games, the good news for Rangers is that they won all four matches they have played so far on xG. In fact, their draw with Hearts was a hugely one-sided affair, and the real result in this game is in fact the least likely outcome of any match played thus far this season.
It is only in the aforementioned Hearts game where Rangers have failed to score the goals that would be expected, generally their finishing has kept up with the chances they have created. At the back they were unlucky to concede three against Hibs, but again they are performing close to their xG values. Their xG for of 8.31 is nicely high, but a xG against of 4.45 is slightly on the high side for a team of Rangers' stature.
Rangers have been pretty smart with their shooting, with not too many wasteful long shots, and plenty of good chances inside the area. Their concern at the back will be the quality of the chances they are conceding in the box, but if they can improve there they should be in good shape for the season.
Ross County
Match |
Real result |
xG For |
xG Against |
P(win) |
P(draw) |
P(loss) |
Dundee (A) |
Won 2-1 |
1.66 |
1.49 |
40.8% |
26.6% |
32.6% |
Aberdeen (H) |
Lost 2-1 |
0.60 |
3.08 |
1.2% |
6.3% |
92.5% |
Motherwell (A) |
Lost 2-0 |
1.08 |
1.72 |
18.9% |
26.4% |
54.7% |
Rangers (H) |
Lost 3-1 |
0.83 |
2.18 |
7.2% |
18.3% |
74.5% |
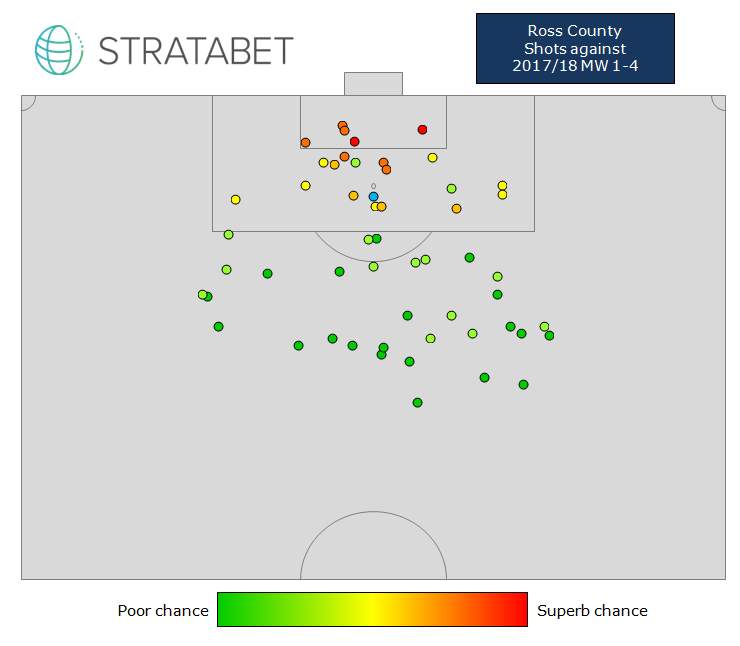
Ross County were in the bottom half of the table when it split last season, but finished strongly to finish in a comfortable 7th, 'winning' the bottom half. They started well this season, beating Dundee, but three defeats since isn't ideal.
Those three defeats have been well-deserved, with very low win likelihoods, and in all cases they were more likely to lose than to either win or draw. On balance they created better chances than Dundee in their opening match, although it was really a match that could have gone either way.
Their 4 goals is more or less bang on their xG prediction (4.17). Whilst this isn't a particularly low score, they have averaged 0.84 in their last three games, which will need improving. At the back they don't look solid, as an xG against of 8.47 is very high, and the fact that the lowest xG they have conceded is 1.49 shows that all their opponents have found ways through their defence.
Ross County's shot map shows a decent volume of shots, but plenty from roughly 30 yards out, and not many of a good quality. And at the back they have given away plenty of clear-cut chances. In fact, nearly all the shots they have faced in the box have been of a reasonably high xG. The way Ross County have started, they have work to do to avoid a relegation fight.

St. Johnstone
Match |
Real result |
xG For |
xG Against |
P(win) |
P(draw) |
P(loss) |
Kilmarnock (A) |
Won 2-1 |
0.98 |
1.11 |
30.5% |
31.4% |
38.2% |
Motherwell (H) |
Won 4-1 |
2.31 |
1.69 |
53.5% |
23.1% |
23.4% |
Partick Thistle (H) |
Won 1-0 |
1.15 |
0.24 |
64.4% |
29.0% |
6.6% |
Celtic (A) |
Drew 1-1 |
1.14 |
3.04 |
7.8% |
13.7% |
78.5% |
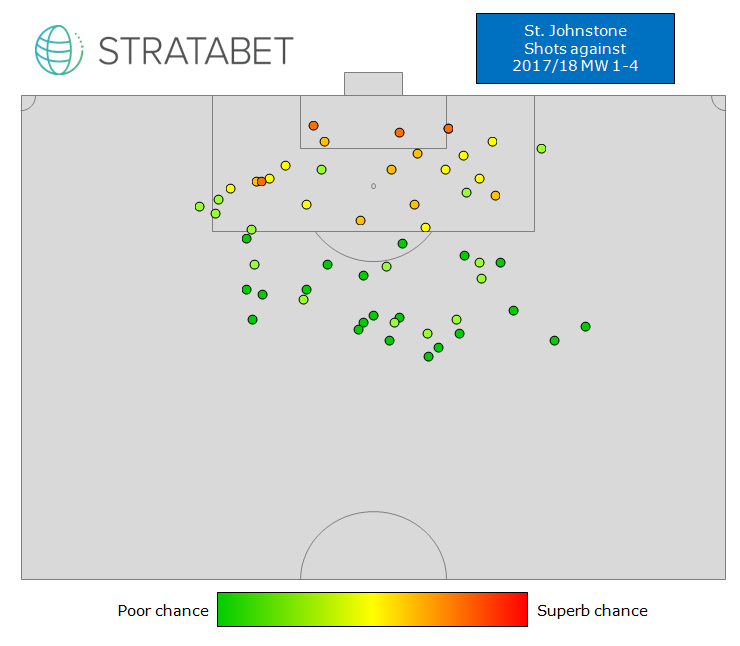
A good fourth position was secured last year, although St. Johnstone were already out of Europe by the time the league season started. However, that extra practice may have helped, as three wins and a draw (vs. Celtic) has put them in third position.
St. Johnstone were slightly lucky to win against Kilmarnock, with their opponents having a higher xG, but victories against Motherwell and Partick were earned. Once again lucky was on their side at Parkhead, as Celtic had a 78.5% chance of winning there.
With an xG for of 5.58, but 8 actual goals scored, St. Johnstone will have to be wary of what might happen should their finishing drop off, but for now they are reaping the benefits of variance. Again, Lady Luck is on their side at the back, where their xG against is 6.08, compared to only 3 goals conceded.
Looking at the shot maps for and against, the chances they have conceded do appear to be of a better quality than those they have made themselves. So whilst there's no doubt St. Johnstone are a good side, their current position is probably somewhat exaggerated given their performances.

Expected table
Using the data above, we can calculate an expected table. To do this, we simply assign each side the following points for each match:
Using the data above, we can calculate an expected table. To do this, we simply assign each side the following points for each match:
[3 x P(win)] + P(draw)
So for example, in the match between Hibernian and Partick, Hibs had a P(win) of 81.2% and a P(draw) of 13.0%. So their expected points tally from that game would be:
[3 x 0.812] + 0.130 = 2.57
So hypothetically, if this match was played an infinite number of times with the same chances being made, we would expect Hibs to take 2.57 points on average.
Using this method, we get the following table:
Using this method, we get the following table:
|
As you'd probably expect, Celtic lead the way. But Aberdeen are virtually matching them in both measures. Whether that can be kept up throughout the rest of the season will remain to be seen. Meanwhile Rangers are once again comfortable in third, whilst Hibs are currently poking out as the best in a congested mid-table.
In fact, to highlight how close the league actually is, St. Johnstone (3rd with 10 points in the real table) are places only 0.39 points higher than Dundee (11th with 1 point in the real table). At the bottom Partick are quite a way from the rest, particularly in xGD.
Summary
We have been able to use our new data and metrics to get an idea of how the teams in the SPL are actually doing, other than just looking at the real table.
It goes without saying that the results presented here are measuring one specific thing - the quality of chances created. For example, it doesn't consider each team's finishing ability; generally we would expect the better teams to outperform their xG value, because they should have forwards who can score from more difficult situations. However, this is one of the best ways to compare the actual performance of sides.
This article was written with the aid of StrataData, which is property of Stratagem Technologies. StrataData powers the StrataBet Sports Trading Platform, in addition to StrataBet Premium Recommendations.
 RSS Feed