by Dr Adrian Worton
Two years ago, in snooker's 2018 UK Championship, Neil Robertson came from 3-0 behind to beat Thailand's Thepchaiya Un-Nooh 6-3. When asked about the dramatic change in fortune in this match, the Australian said:
Two years ago, in snooker's 2018 UK Championship, Neil Robertson came from 3-0 behind to beat Thailand's Thepchaiya Un-Nooh 6-3. When asked about the dramatic change in fortune in this match, the Australian said:
“When I’m playing at 18-20 seconds a shot I’m winning matches, usually when I lose I’m playing too slowly. It’s good that World Snooker are showing the average shot times because you can really analyse where you are going wrong.”
Ever since then, whenever the former World Champion plays, the commentators and pundits reference this. Always. If Robertson is playing badly, they always look to his average shot time (AST) and say that if he can get it below 20 he should win.
Since Neil said that the average shot time data means you can really analyse what the players are doing, we're going to do exactly that. In this article we'll look at whether it is true that Robertson plays better when he plays faster, and see if we can explain why.
Robertson's AST
Let's start by directly assessing Robertson's claim that he tends to win when he gets his AST below 20 seconds. We have looked back at all the matches for which the brilliant website Cuetracker has AST data (not including the Snooker Shootout, which is an event where players play against a shot clock).
When Neil Robertson has an AST below 20 seconds, he won 31 of 35 matches (88.6%), whilst when he was over 20 seconds he won 137 out of 195 matches (70.2%). So, on the face of it, it does look like Neil does better when he plays faster.
We can get a more nuanced view of Neil's shot time vs performance. To get a more detailed measure of performance (rather than just "won/lost"), we will use his 'points difference per frame' (PDpF). This simply sees how many more points Neil makes compared to his opponent, average across all frames.
So for example, in this year's World Championship Robertson beat Liang Wenbo 10-5 and out-scored him 1102-589 in terms of points. So, Neil's PDpF for this match is: (1102 - 589) / 15 = 34.2. Later in the same tournament, Neil was out-scored 1327-831 as he lost 13-7 to Mark Selby, and so his PDpF is (831 - 1327) / 20 = -24.8.
Below is a scatter plot of Neil's shot time versus his PDpF for all his matches in our data:
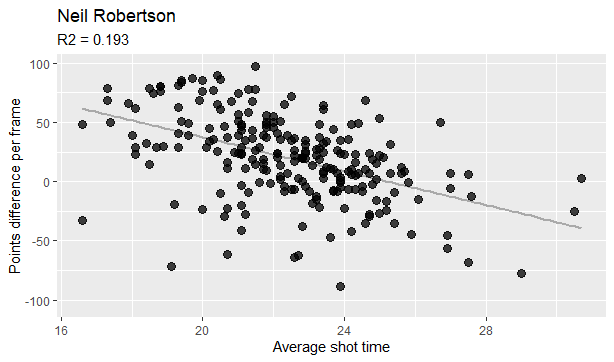
Interestingly, if our measure of success was the percentage of frames won, then the R2 value is still 0.193 for Neil Robertson.
So, as expected, we can see that there's a negative correlation - in other words, when Robertson's AST is lower, his PDpF is higher (i.e. he plays better when he plays faster).
The R2 value (meant to be R squared, but I cannot get a superscript 2...) is a measure of how much the variance in the response can be predicted by the independent variable. So in this case, we can say that 19.3% of variance in Neil's PDpF can be predicted by his AST.
This isn't especially high, and looking at the graph it doesn't appear to be a particularly strong relationship. What we can see is that the strongest performances - where Neil's PDpF is over 75 - all come when his AST is below 22 seconds. The opposite doesn't appear to be true, though, as his weakest matches (where his PDpF is below -50) seem to be fairly spread in terms of AST.
Other players
So, it does appear that Robertson's performances are better when he is playing faster. Is this a trait unique to Neil?
Below is the win percentage for each of the current top 16 (as of the end of 2020) when they play fast (AST < 20) or slow (AST > 20):
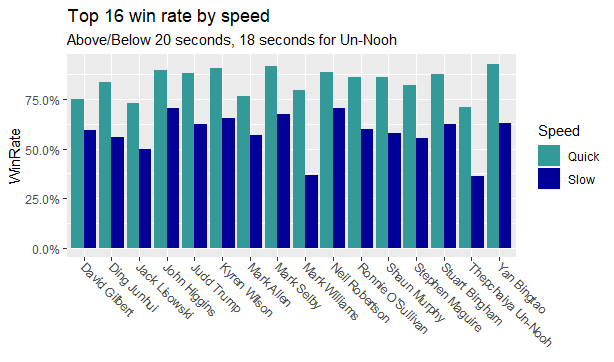
Because Thepchaiya Un-Nooh plays so fast, there are only four matches where his AST is over 20 seconds. Therefore, we have used 18 seconds as his cut-off.
The first thing to say is that it definitely isn't a unique thing to Neil Robertson that he does better when his AST is lower - this applies to every player in the top 16. In fact, only David Gilbert has a smaller difference between his quick and his slow win rates (15.8%, compared to 18.0% for Robertson).
So, the unwritten rule of snooker punditry that you have to mention Robertson's AST whenever he's playing seems redundant, because it applies to every player.
Do any of these players have a stronger relationship between speed & outcome than Neil? Yes, in fact Neil's R2 value of 0.193 places him just 13th in the top 16. Below are the graphs of the 5 players with the highest correlation:
It's interesting that Mark Selby has the highest correlation between his speed and his performance, since he is stereotyped as a slow player. Yan Bingtao has the 5th-highest correlation, and has a similar speed to Selby (both average around 24.5 seconds this season). But by contrast, notably fast players Judd Trump and Thepchaiya Un-Nooh are also in this list.
Other factors
For the top 16, the average R2 is 0.212, which means that 21.2% of variation in PDpF is explained by AST, and vice versa. We can look at other factors to see whether we can glean any information.
First of all, let's look at Neil Robertson's performance by date, over the matches in our data:
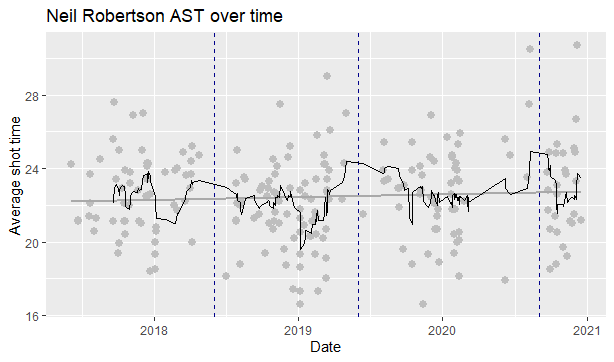
The black wiggly line is the 10-match rolling average. The overall trend (grey line) is very slightly ascending, but the difference between the start and end is only around half a second, which suggests Robertson's speed has been consistent across the data.
The dashed blue lines represent the end of each season, and what we can see is that at the end of each season the rolling average is generally much higher than elsewhere. Each season ends with the World Championship, which has a significantly longer match length than other competitions. This suggests there might be a relationship between match length and AST. So, let's have a look:
The dashed blue lines represent the end of each season, and what we can see is that at the end of each season the rolling average is generally much higher than elsewhere. Each season ends with the World Championship, which has a significantly longer match length than other competitions. This suggests there might be a relationship between match length and AST. So, let's have a look:
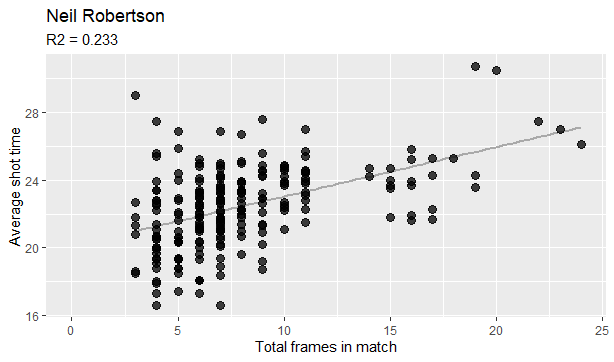
There is a decent relationship here, with a stronger correlation than that between AST & PDpF. So, it suggests that in the longer matches Robertson's game slows down. It is not clear whether this is a tactical decision to pace himself or because the longer format allows his opponents to slow things up.
Throughout a given tournament, longer matches tend to occur later in the tournament. For example, most finals are usually best of 17s or longer. The exception is the World Championship, which has long matches from the beginning. The World Championship is also a rare tournament that guarantees the top 16 automatic qualification for the last 32. All this goes to say that generally the longer the match length, the higher the quality of the opposition. So maybe there is a link between shot time and opponent quality? Using their end-of-season rank (end-of-year rank for the 2020/21 season), we can plot AST vs rank:
Throughout a given tournament, longer matches tend to occur later in the tournament. For example, most finals are usually best of 17s or longer. The exception is the World Championship, which has long matches from the beginning. The World Championship is also a rare tournament that guarantees the top 16 automatic qualification for the last 32. All this goes to say that generally the longer the match length, the higher the quality of the opposition. So maybe there is a link between shot time and opponent quality? Using their end-of-season rank (end-of-year rank for the 2020/21 season), we can plot AST vs rank:
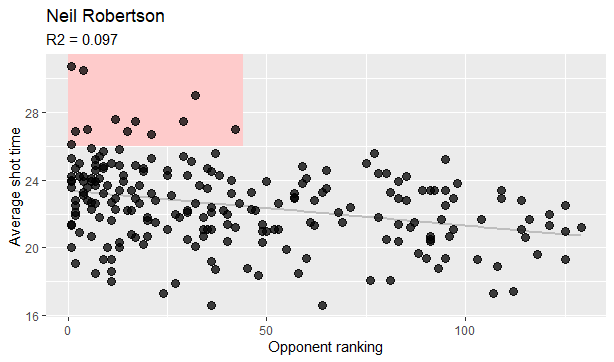
In this case there is very little relationship between rank and AST. In particular, Neil's medium- and fast-paced matches occur against players anywhere in the rankings.
But what we can see is that his slowest matches do come against the higher-ranked players (pink rectangle). The only matches where his AST is over 30 seconds comes in long-format matches against players ranked 4th (Mark Selby in the 2020 World Championship) and 1st (Judd Trump in the 2020 UK Championship), and all matches where his AST come in matches against players ranked 42 or higher.
We can see similar patterns with other top players:
The most notable of these is Ronnie O'Sullivan. Firstly, all 24 matches where his AST is over 20 seconds come against players in the top 50, and all 5 matches where his AST was over 22 seconds came against players in the top 10.
To emphasise this, there is actually a fairly strong correlation between AST and rank for O'Sullivan, with an R2 value of 0.278.
Speed vs Success or Success vs Speed?
When we looked at AST vs PDpF (our first scatterplots), we had AST on the x-axis and PDpF on the y-axis.
The factor on the x-axis is typically the 'independent' variable, with the factor on the y-axis the 'response' variable. Generally, you expect the response variable to be 'caused' by the independent variable. We placed the AST on the x-axis to keep it consistent with the assertion from Robertson and pundits that he plays better when he plays faster.
However, it has been a long-held belief of mine that this relationship is likely to be the other way around:
So in other words, it's far more likely that playing well leads to a low AST, rather than a low AST leading to you playing well (as seems to be assumed particularly with Neil)...
— Adrian Worton (@RedOwl14) August 10, 2020
You can click through to the tweet above to read a longer thread.
It clearly takes longer for a player to play a safety shot than it will a pot in the middle of a break. They arrive at the table and assess it before playing the shot, whilst during a break they tend to already know what they will be trying with their next shot.
Our analysis suggests that AST tends to be higher when playing in longer matches, which also tend to be matches that can get bogged down with long safety exchanges. We also saw that playing top-ranked players can lead to a high AST, which makes sense as these are more likely to be matches where your opponent dominates table time.
We will go into this in more detail next time by breaking a match down into individual shots to try and demonstrate how AST is driven by shot difficulty, and therefore performance level influences AST rather than the other way around.
Summary
Below are the key points from this article:
- For all members of the top 16, they have a higher win rate when they play faster than when they play slow.
- The top players whose performance is most closely related to their shot time are Mark Selby, Kyren Wilson, Judd Trump, Thepchaiya Un-Nooh and Yan Bingtao.
- Neil Robertson's shot time rose at the end of each season, seemingly caused by the long matches from in the World Championship. There is a fairly strong correlation between match length and AST.
- On the face of it, there isn't a good relationship between opponent level (measured by ranking) and AST. However, we do see that players see their slowest matches against top-ranked players.
 RSS Feed