by Adrian Worton
Introduction
Two months ago I completed a database of statistics for Premiership clubs from 1995 onwards. We have now been able to break down the numbers, using correlations, to answer the following questions:
Introduction
Two months ago I completed a database of statistics for Premiership clubs from 1995 onwards. We have now been able to break down the numbers, using correlations, to answer the following questions:
- Which has a bigger effect on a team's performance, goals scored or goals conceded? And does this change depending on which half of the table the team is in?
- How reliable an indicator towards position are the amount of corners for and against a team, the amount of shots per game, shot accuracy and the amount of penalties for and against?
Previously we had a look at answering the first of those questions, today we will be working on the second one.
The Data
For an explaination of what data our spreadsheet contains, as well as an explanation of how correlation works and what it tells us, see the previous article.
Correlations
Using the same method as yesterday, we are going to find the correlation between position and:
- Corners for
- Corners against
- Shot accuracy
- Shots on target
- Penalties for
- Penalties against
Pearson correlation of Pos and C/G F = -0.597
P-Value = 0.000
Pearson correlation of Pos and C/G A = 0.635
P-Value = 0.000
Pearson correlation of Pos and %OT = -0.277
P-Value = 0.000
Pearson correlation of Pos and OT/G = -0.643
P-Value = 0.000
Pearson correlation of Pos and Pen F = -0.281
P-Value = 0.000
Pearson correlation of Pos and Pen A = 0.335
P-Value = 0.000
The first thing to notice is that all the p-values are below 0.0005, which shows that all of these factors are reliable indicators of position. For position, unlike points, a lower number is better than a higher one (i.e. you'd rather finish 1st than 20th), so factors with a negative correlation are actually showing a positive relationship between the factor and success in the league.
Below are the scatter-graphs for these correlations:
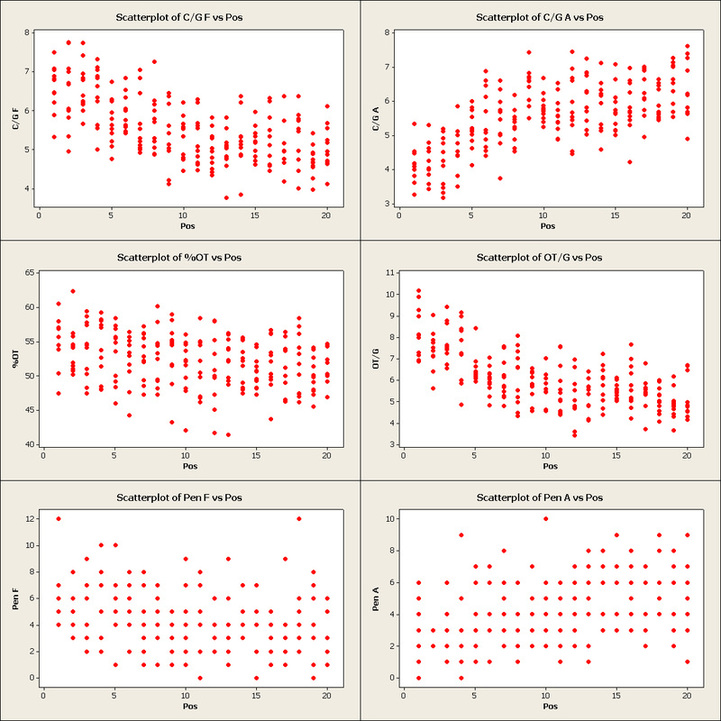
There is statistically significant evidence that the teams higher up the table get more penalties, but that is to be expected as these teams will spend more time in the opposition's penalty area. The weakness of this relationship though suggests that there is no bias towards larger teams, and that the amount of penalties given is a pretty poor predictor of league position.
An even weaker indicator of position is the percentage of shots on target. Again, this is significant, which is unsurprising. But the weakness of the relationship shows that simply getting shots on target doesn't win games. A much higher correlation is found between position and the amount of shots on target per game. This implies that some of the teams with high shot accuracy have a lower league position due to their caution in shooting.
Finally, we move onto corners. There is a pretty high link between corners for and against and position. This is a result, of course, of the better teams being in positions to collect more corners than the teams further down the table. It is a pretty good indicator of position.
Conclusion
There have been suggestions that teams have been adopting a "Moneyball" technique to tactics, whereby if you dominate certain statistics, winning games will follow. Our correlation tests show that whilst there are links between some of these key statistics and league position, the indicators are relatively weak, and perhaps the teams who weaken this relationship are the teams who try and significantly change the way they play in order to, for instance, get shots on target, or corners.
What we have found is a way of comparing the important of such statistics. And we have found that the amount of shots on target per game is the most telling predictor of position. What we have also noticed is that penalties and corners against are more significant than penalties and corners for.
If anyone can find data for team data on things such as pass completion, passes per game, possession, it would be fascinating to compare these to our results here.
Sources
See previous article.
 RSS Feed