by Adrian Worton
Introduction
Two months ago I mentioned that I had collated a database of statistics for Premiership clubs from 1995 onwards. I expected to publish my analysis of this stats a lot earlier, however a broken laptop and the end of University got in the way.
Introduction
Two months ago I mentioned that I had collated a database of statistics for Premiership clubs from 1995 onwards. I expected to publish my analysis of this stats a lot earlier, however a broken laptop and the end of University got in the way.
Now we can have a look at breaking down the facts and figures; we will be looking to see what statistics have the greatest effect on results, as well as looking for other correlations. The questions we will be answering are:
We will be looking at the correlation between these factors to give us our answers.
In this article, we will be looking at answering the first question.
- Which has a bigger effect on a team's performance, goals scored or goals conceded? And does this change depending on which half of the table the team is in?
- How reliable an indicator towards position are the amount of corners for and against a team, the amount of shots per game, shot accuracy and the amount of penalties for and against?
We will be looking at the correlation between these factors to give us our answers.
In this article, we will be looking at answering the first question.
The Data
Initially, we had collated the final league tables for every Premiership season, up until 2010/11. However, the first three seasons of the Premier League featured 22 teams, moving towards a 20-team league. In order to keep the data consistent, we elected to only use the data from the 20-team seasons.
The data we initially collected included the basic information available from the league table. We then found data for other statistics (not necessarily for every season) from various websites. This gave us the following data:
- Games won, drawn and lost
- Goals scored and conceded
- Goal difference
- Points
- Corners per game (for and against)
- Shots per game (for and against)
- Shot accuracy (percentage and number of on-target shots per game)
- Penalties (for and against)
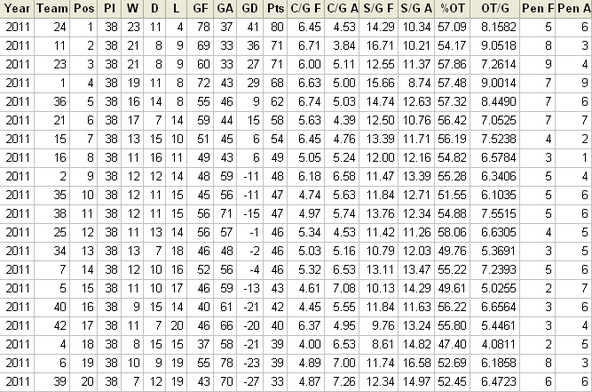
As we are using MiniTab, which hates the use of anything other than numbers in the spreadsheet, teams are represented by a number. These numbers are just based on the alphabetical position of the team, so Arsenal are 1, and Wolves are 42 (as there are 42 different teams in the database).
We are now able to use the data to answer our questions.
Analysis
We will be using the statistical technique of correlation. We will ask MiniTab to find the correlation between two variables (for example 'Goals Scored' and 'Points'). The resulting value is known as Pearson product-moment correlation coefficient. This measures the linear relationship between the two variables. So if two variables were perfectly linked - for example for school children 'Age on September 1st' and 'School year' will be almost perfectly linked, then their correlation will be 1. And if two thinks were perfected linked but in a negative manner, for example 'Age' versus 'Years until reaching 100', the correlation will be -1. The weaker the relationship, the closer it is to 0.
We won't be considering how correlation is worked out, as MiniTab will do it for us (it's relatively simple, but with the amount of data we're using, it would be impractical).
If we square a correlation, we will find out how much of the variability in one factor is explained by the other. So if the correlation between two variables was 0.5, then the square of that, 0.25, means that 25% of the variability in one factor is explained by the other. 75% is explained by other factors.
We will also be given by MiniTab a "p value". This is the probability of getting the result we have if the variables are in no way correlated (i.e. what are the chances of coincidentially getting such a result?). It is common statistical practise to say that if p is lower than 0.05, then there is a significant relationship between the two variables.
With all this in mind, we can now try to answer the questions we have.
Goals Scored versus Goals Conceded (1995/96 - 2010/11)
Clearly in football teams can be either attacking or defensive. If you're an attacking side, you may score a lot, but run the risk of conceding more - if your strikers aren't up to the job of finishing your chances, this might be a risky strategy. However, if your team is defensive, you might restrict the opposition's chances, but you're also going to stuggle to get the men up the pitch to create chances at the other end.
Therefore managers need to know whether being attacking or defensive is the best option for them. One way to find out is to see whether goals scored or goals conceded has the bigger impact on a team's points tally. So we are going to look at the correlation between goals scored and points, and goals conceded and points, the higher of the two values will tell us which has the bigger impact for teams.
Running the data through MiniTab gives us the following results:
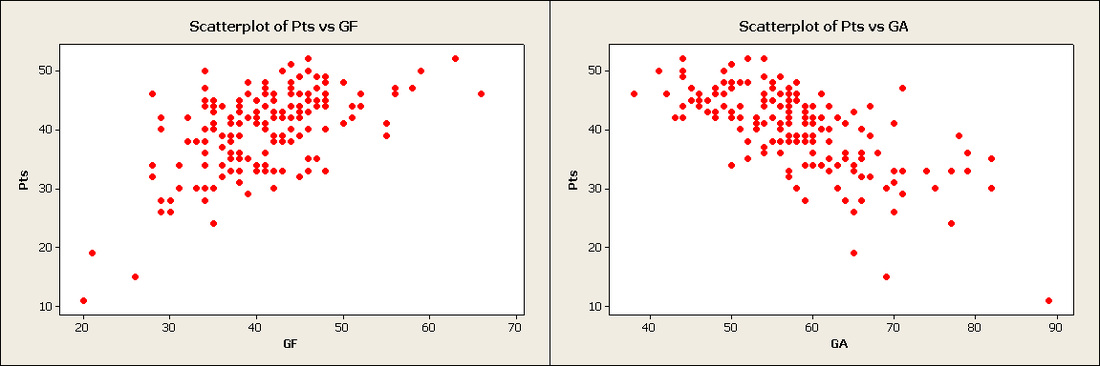
Pearson correlation of GF and Pts = 0.869
P-Value = 0.000
Pearson correlation of GA and Pts = -0.848
P-Value = 0.000
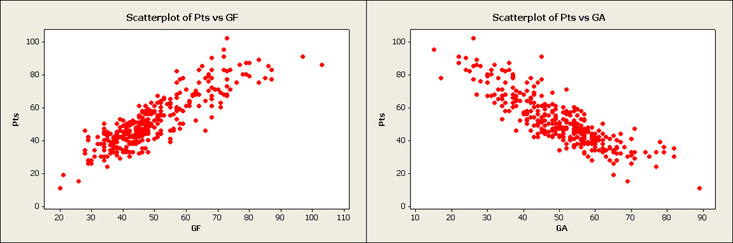
This shows that the benefit from scoring more goals is marginally higher than the benefit of avoiding conceding more goals. The p-values of both correlations is below 0.0005, which is unsurprising, as all that tells us is that teams who concede less and score more get more points.
Below are the scatterplots for the data, showing the strength of the relationships. Any difference between the two graphs is marginal in terms of which one shows a stronger linear relationship.
We are now able to use the data to answer our questions.
Analysis
We will be using the statistical technique of correlation. We will ask MiniTab to find the correlation between two variables (for example 'Goals Scored' and 'Points'). The resulting value is known as Pearson product-moment correlation coefficient. This measures the linear relationship between the two variables. So if two variables were perfectly linked - for example for school children 'Age on September 1st' and 'School year' will be almost perfectly linked, then their correlation will be 1. And if two thinks were perfected linked but in a negative manner, for example 'Age' versus 'Years until reaching 100', the correlation will be -1. The weaker the relationship, the closer it is to 0.
We won't be considering how correlation is worked out, as MiniTab will do it for us (it's relatively simple, but with the amount of data we're using, it would be impractical).
If we square a correlation, we will find out how much of the variability in one factor is explained by the other. So if the correlation between two variables was 0.5, then the square of that, 0.25, means that 25% of the variability in one factor is explained by the other. 75% is explained by other factors.
We will also be given by MiniTab a "p value". This is the probability of getting the result we have if the variables are in no way correlated (i.e. what are the chances of coincidentially getting such a result?). It is common statistical practise to say that if p is lower than 0.05, then there is a significant relationship between the two variables.
With all this in mind, we can now try to answer the questions we have.
Goals Scored versus Goals Conceded (1995/96 - 2010/11)
Clearly in football teams can be either attacking or defensive. If you're an attacking side, you may score a lot, but run the risk of conceding more - if your strikers aren't up to the job of finishing your chances, this might be a risky strategy. However, if your team is defensive, you might restrict the opposition's chances, but you're also going to stuggle to get the men up the pitch to create chances at the other end.
Therefore managers need to know whether being attacking or defensive is the best option for them. One way to find out is to see whether goals scored or goals conceded has the bigger impact on a team's points tally. So we are going to look at the correlation between goals scored and points, and goals conceded and points, the higher of the two values will tell us which has the bigger impact for teams.
Running the data through MiniTab gives us the following results:
Pearson correlation of GF and Pts = 0.869
P-Value = 0.000
Pearson correlation of GA and Pts = -0.848
P-Value = 0.000
This shows that the benefit from scoring more goals is marginally higher than the benefit of avoiding conceding more goals. The p-values of both correlations is below 0.0005, which is unsurprising, as all that tells us is that teams who concede less and score more get more points.
Below are the scatterplots for the data, showing the strength of the relationships. Any difference between the two graphs is marginal in terms of which one shows a stronger linear relationship.
However, maybe the benefits of conceding less goals are more important at the top of the table, where teams have the strikers to win games when there are few chances, or maybe it's more important at the bottom, where a 0-0 draw can feel like a win when teams around you are losing.
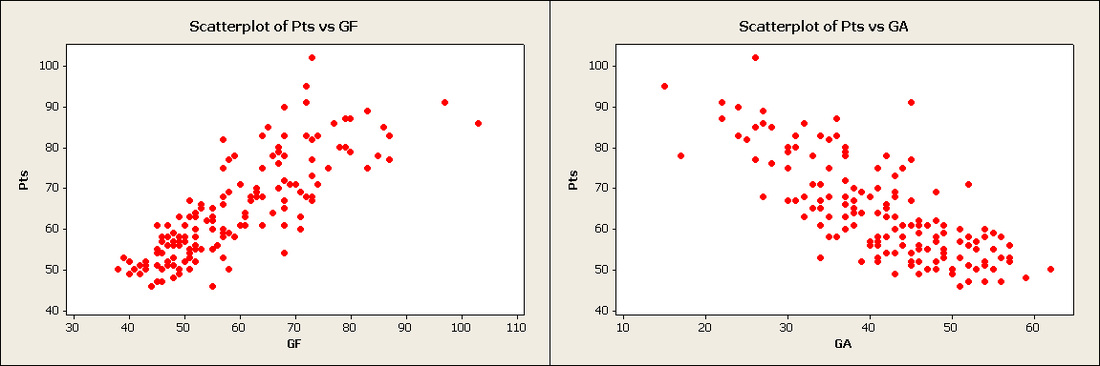
Therefore we can do the same analysis but segregate teams into top and bottom-half teams. So first of all, for top-half teams:
Pearson correlation of GF and Pts = 0.822
P-Value = 0.000
Pearson correlation of GA and Pts = -0.770
P-Value = 0.000
The first thing to notice is that the correlations are slightly weaker than for the overall data. This isn't surprising, as this just means that the difference between 1st and 10th is slightly less clear than the difference between 1st and 20th.
But now we can also see that there is a clear gap between the correlations - scoring goals is more valuable in the top half of the table. So, for title-chasers, money spent on a top class strike force is more likely to bring dividends than money spent on a top defence.
Below again are the scatter-graphs. This time it is perhaps easier to see that the graph on the left (goals scored) is a slightly stronger linear relationship, although the data does fan out for the very top teams.
Now, for the bottom half of the table:
Pearson correlation of GF and Pts = 0.572
P-Value = 0.000
Pearson correlation of GA and Pts = -0.670
P-Value = 0.000
Again, the first thing to notice is that the correlations are lower than for the top half. This is unsurprising. In the Premier League, there is always far less of a difference between the teams in mid-table and the teams in the relegation zone than there is between teams in mid-table and the title-chasers. For example in the season just gone, 42 points seperated 10th-placed West Brom and 1st-placed Man City, whilst only 22 points seperated 11th-placed Swnsea and 20th-placed Wolves.
But more striking is the actual values of the correlations - we can see here that preventing goals is far more important for teams near the drop than scoring goals. The scatter-graphs below back this up, with the graph of the left (goals scored) being a fairly weak linear relationship, certainly out of the six in this article. This shows how teams can score plenty of goals but still not rack up many points, whereas teams who concede little rarely tend to get few points.
This implies that teams getting promoted should take the Stoke rather than the Swansea method for staying up.
Conclusion
Having explored the use of correlation, and how it can show us the strength of the relationship, we have used it to show that the priorities of teams vary depending on where they are in the table.
For teams fighting to survive in the Premiership, it is advisable to focus on preventing goals, as there is a stronger relationship between goals against & points than there is between goals for & points.
However, for teams who are comfortable within the division, and want to become title-challengers, then scoring goals will pay greater rewards. This explains why strikers command the highest transfer fees, because for all the clean-sheets and possesion that a good defence and midfield will give you, you need to be able to break down other teams to get the points.
One other result from this also suggests that if football administrators want to encourage more exciting football in the Premier League, they ought to find ways of incentivising teams lower in the Premiership to attack, because the way the league currently is, it's in their interests to be more defensive.
Next time we will be looking at answering question 2.
Sources
Wikipedia - final league tables for every Premiership season from 1995/96 to 2010/11.
http://www.myfootballfacts.com/
http://www.wikipedia.org/
http://www.footstats.co.uk/
http://www.wikipedia.org/
http://www.footstats.co.uk/
 RSS Feed