by Adrian Worton
Introduction
This week, we are going to build a simulator for the 2014 World Cup. A key part of this is weighting the probability of each team winning a given match to reflect their real-life chances.
Introduction
This week, we are going to build a simulator for the 2014 World Cup. A key part of this is weighting the probability of each team winning a given match to reflect their real-life chances.
There are many ways to quantify the relative strength of teams: recent form, world ranking, value of squad, past meetings, and so on. However, rather than spending huge amounts of time trying to tie all these factors into one model, bookies' odds can be used instead, since they take all these factors into account when creating their odds. Therefore, we just need a way of converting the odds into an actual probability.
How Odds Work
For the opening match of the World Cup, between Brazil and Croatia, the odds for the result of the match are as follows:
If the bookies created the odds to exactly reflect the probability of that outcome, then the probability of Brazil winning would be 10/(3+10) = 76.9%. However, they need to make a profit, so the odds are shortened slightly. However, the odds will all have been shortened by the same proportion, such as 5%, for the bookies to try and people to bet on each result proportional to the chance of it occurring, in order to guarantee a profit. Therefore, we can still assume that the odds are a fair representation of each result, compared to the other outcomes.
Measuring Team Strength
The odds currently give the lower score to the better team, however, we need values which are higher when a team is better, so in order to find those the reciprocal of each odd is found. This is simply a case of turning the odds upside-down. So for example, Brazil's 3/10 becomes 10/3.
If we switch the resulting values from fractions to decimal form, we get the following:
We will call these three values the coefficients for each result.
Finding the Probabilities
How Odds Work
For the opening match of the World Cup, between Brazil and Croatia, the odds for the result of the match are as follows:
- Brazil win: 3/10
- Draw: 18/5
- Croatia win: 9/1
If the bookies created the odds to exactly reflect the probability of that outcome, then the probability of Brazil winning would be 10/(3+10) = 76.9%. However, they need to make a profit, so the odds are shortened slightly. However, the odds will all have been shortened by the same proportion, such as 5%, for the bookies to try and people to bet on each result proportional to the chance of it occurring, in order to guarantee a profit. Therefore, we can still assume that the odds are a fair representation of each result, compared to the other outcomes.
Measuring Team Strength
The odds currently give the lower score to the better team, however, we need values which are higher when a team is better, so in order to find those the reciprocal of each odd is found. This is simply a case of turning the odds upside-down. So for example, Brazil's 3/10 becomes 10/3.
If we switch the resulting values from fractions to decimal form, we get the following:
- Brazil win: 10/3 = 3.333
- Draw: 5/18 = 0.278
- Croatia win: 1/9 = 0.111
We will call these three values the coefficients for each result.
Finding the Probabilities
It is now very simple to translate these coefficients into the probability of each outcome happening.
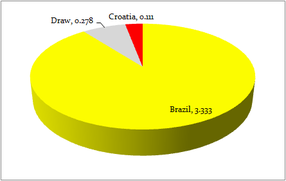
If the three coefficients were placed on a pie chart (see right), the probability of each team winning is the same as how much of the pie chart they take up.
To find this, we divide each value by the total of all values. So for our example, the total of the three coefficients is 3.722, and our three probabilities are:
Simulating the Result
For our simulator, we will want to find the winner of the match based on these probabilities. To do this we find the cumulative probability for each result:
If the three coefficients were placed on a pie chart (see right), the probability of each team winning is the same as how much of the pie chart they take up.
To find this, we divide each value by the total of all values. So for our example, the total of the three coefficients is 3.722, and our three probabilities are:
- Brazil win: 3.333/3.722 = 89.6%
- Draw: 0.278/3.722 = 7.5%
- Croatia win: 0.111/3.722 = 3.0%
Simulating the Result
For our simulator, we will want to find the winner of the match based on these probabilities. To do this we find the cumulative probability for each result:
- Brazil win: 0.896
- Draw: 0.896 + 0.075 = 0.970
- Croatia win: 0.970 + 0.030 = 1.000
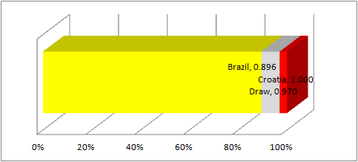
These values can now provide boundaries:
Running five random simulations gives values of 0.0659 (Brazil win), 0.6236 (Brazil), 0.3970 (Brazil), 0.9752 (Croatia win), 0.0207 (Brazil). In the long run, Brazil will win 89.6% of matches, and 3% will be won by Croatia.
Summary
Bookies' odds are rooted in probability and statistics. However, they are weighted in order to guarantee them a profit. These can be transformed with relative ease into the actual probabilities, at least according to whatever analysis the bookies have used, of each possible outcome.
This mechanism will be the cornerstone of our upcoming World Cup simulator.
- 0.000 - 0.896: Brazil win
- 0.896 - 0.970: Draw
- 0.970 - 1.000: Croatia win
Running five random simulations gives values of 0.0659 (Brazil win), 0.6236 (Brazil), 0.3970 (Brazil), 0.9752 (Croatia win), 0.0207 (Brazil). In the long run, Brazil will win 89.6% of matches, and 3% will be won by Croatia.
Summary
Bookies' odds are rooted in probability and statistics. However, they are weighted in order to guarantee them a profit. These can be transformed with relative ease into the actual probabilities, at least according to whatever analysis the bookies have used, of each possible outcome.
This mechanism will be the cornerstone of our upcoming World Cup simulator.
 RSS Feed