by Dr Adrian Worton
Our last article started as a whimsical look at crowning an overall champion for the old TV series Wacky Races. But it moved on to (some would say bogged down by) a discussion of different ways to distributed points for performances in individual races.
One method we considered was an 'Olympic' style method, where the racers were simply ordered by the number of races won, then by the number of second places, then by the number of third places.
What we found was that the resulting table was very different to any method used in racing to aggregate the results of different races. We played around with different points weightings, and they had to be very, very heavily skewed in favour of the race winners to make the table anything like the Olympic one.
It is going a bit far to say that the rankings used in the Olympics should be changed, but it is fair to say that it is probably a misleading measurement of how well the countries actually performed.
Looking back at the most recent summer Olympics ("2020"), one example is that Japan finished 3rd despite "ROC" (Russia) winning 22% more medals.
Due to the varying nature of the different sports involved, it's impossible to (retrospectively) do a points system for anything other than the three medalists. So let's assign a simple points system where gold = 3pts, silver = 2pts and bronze = 1pt, and compare where countries finished in this method to where they did in the real table:
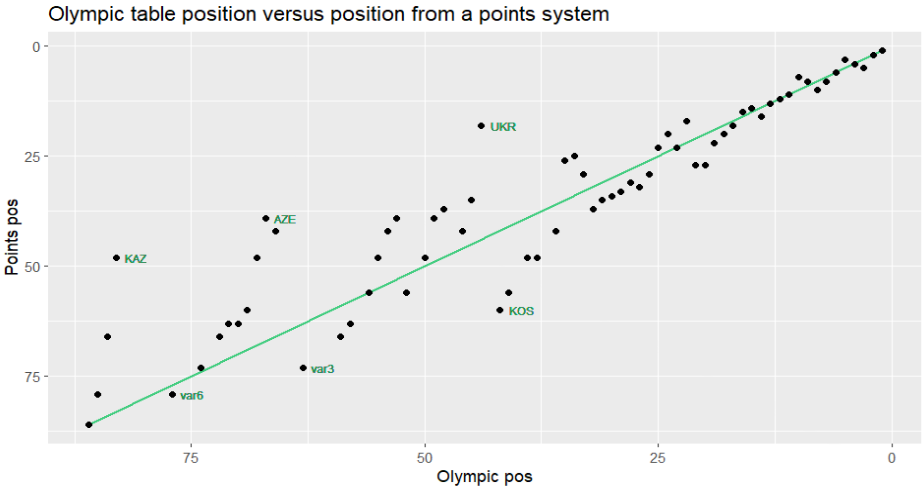
I've highlighted a few cases. Each time, there's a country that accumulated a lot more minor medals than the countries above, but because of a lack of the higher medal finish a lot lower in the table.
Kazakhstan (KAZ) took eight bronze medals, but because none of those could be converted into anything higher, they finished below dozens of teams with fewer medals. The group of nations labelled var6 are six nations who took just one medal - a silver.
Similarly, Azerbaijan (AZE) would have finished in the top 40 with a points-based system thanks to four silvers and three bronzes, but instead finished 67th. Meanwhile the three nations who took just a single gold (var3) finished ahead of Azerbaijan in the official table.
A particularly clear example is Ukraine (UKR), who took 27 medals but only one gold, compared to Kosovo who only claimed two medals, but both were gold. It is very hard to argue that Kosovo performed better than Ukraine overall, but they finish a place ahead in the table.
The graph follows a pleasing diagonal pattern:
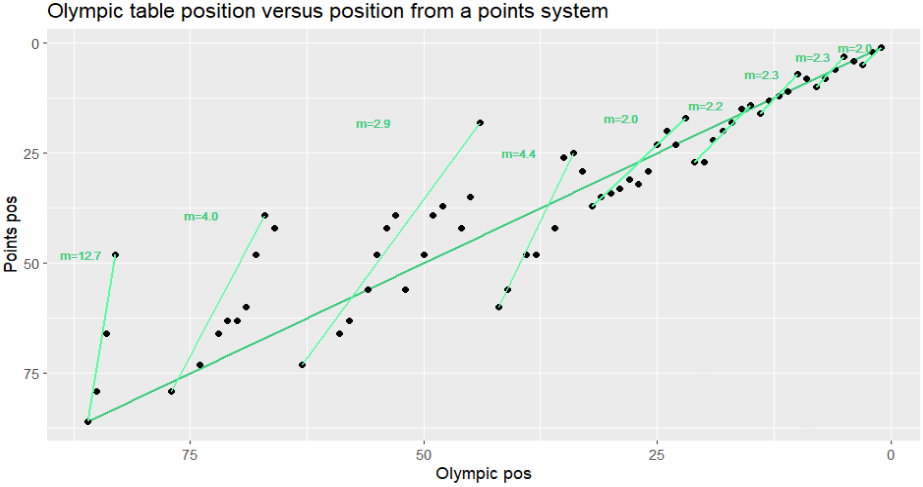
The lines aren't very scentific, but you can see that they appear to be getting less steep the higher the ranking is. To emphasise this point I have added their gradient (m).
Each line effectively represents a mini table between teams with the same number of golds (or silvers, lower down the rankings). For example, the third line from the left covers all the teams with 1 gold medal. Because every single team with 0 golds ranks below, and every single team with 2 golds ranks above, you get the huge steps from the end of one line to the start of the next.
The steeper the gradient is, the bigger the difference between the two scoring systems. And we can see that the higher up the rankings the less steep the lines become. The initial group (which is the group of nations to only win bronze medals) has an extremely high gradient of 12.7, whereas the top five groups all have gradients between 2 and 2.3.
This makes sense. The higher up the table, the more medals teams have by definition. And the law of large numbers suggests that the larger the sample, the less random the result. Crucially, the more medals a nation has, the more likely that they will be split evenly between the different types. Below is the proportion of gold medals for each team:
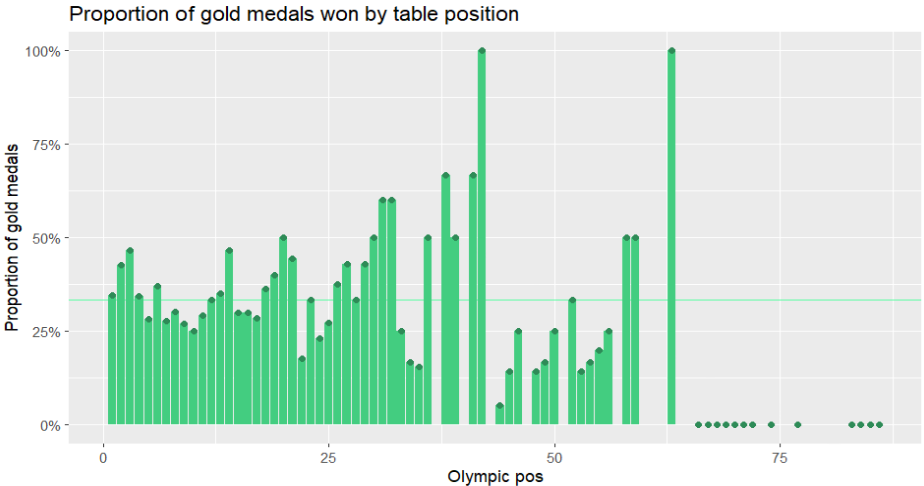
The horizontal line represents a third of medals being gold (there are actually slightly more bronzes awarded due to the combat sports, but let's ignore that)
We can see that the countries on the left of the chart above are generally pretty close to the horizontal line. The fewer medals, the higher variance, and therefore the higher variance in the medal table.
So at the top end of the medal table the weight of numbers means that there is less scope for 'unfairness' in the Olympic medal table, but it is still a system that doesn't particularly tend towards an accurate ranking of teams' performance.
In the UK, Team GB are set an overall medal target, rather than specifically golds. These targets are crucial in terms of funding for individual sports (which is a whole different kettle of row boats). By counting total medals there is less scope for random variation to make a decent performance seem poor - or vice versa.
Generally, topping the Olympic medal table has been the target of much willy-waving from the superpowers, most notably the USA and USSR during the Cold War. We may see this again with China's emergence, although after their own Olympics in 2008 their results have been comfortably behind USA.
But overall, it's hard to judge the impact of the specific measurement the Olympics uses to rank teams. What we can say is that it is quite a big outlier compared to any other system. A more comprehensive system would not only be more accurate, but could give smaller countries more to aim for. But the simplicity of the current system means it's unlikely to change any time soon.
 RSS Feed