by Dr Adrian Worton
Last week we unveiled the TGIAF World Cup 2018 simulator. This article will focus on the method we use to generate odds for the knockout rounds. By checking whether the results are sensible, this will allow us to look at high-value bets in future articles.
Last week we unveiled the TGIAF World Cup 2018 simulator. This article will focus on the method we use to generate odds for the knockout rounds. By checking whether the results are sensible, this will allow us to look at high-value bets in future articles.
Coefficients
We start from a good base. Namely, we already have the odds for the 48 group fixtures. Of course, we don't know who will be lining up in the knockout rounds, so we cannot get odds for these matches. Theoretically any two teams could meet at some point, so we should be capable of creating odds for any two given teams.
Given that the group stages comprises 75% of the matches playing during the tournament, it should be possible to use these known odds to predict the odds for the unknown games.
To do so, we need some measure of the relative strength of the two sides. After looking at a few, we found that the best was simply each team's odds of winning the whole tournament. We call these values coefficients. Below you can see the coefficients for all 32 teams:
|
|
|
|
You may disagree some individual rankings above (I know I do!), but I think it's more important to make sure there's a consistent way of rating the teams rather than just using gut instinct. Plus, these values should be closely aligned to the odds given for the group stage.
Comparing coefficients
So, if we have a match between two teams, it's easy enough to bring up their coefficients. But how do we compare them? If we take one away from the other, we would have results such as:
This feels inherently wrong - is the gap between Japan and Panama bigger than that between Spain and Japan? I'd say not. Therefore, we use division to find a ratio:
This has the Spain-Japan gap as bigger than the Japan-Panama one, which feels right. Basically, division will magnify the differences when the scores are low, whilst subtraction magnifies differences when the scores are big. This is why we no longer use goal average.
Creating odds
So... given two teams, we divide one team's coefficient by the others' to help us create their odds of winning the match. Let's take Portugal vs. Serbia:
We can see that the better team will have the lower ratio. Comparing these ratios with the odds given for the group stage matches, we get the following graph:
Comparing coefficients
So, if we have a match between two teams, it's easy enough to bring up their coefficients. But how do we compare them? If we take one away from the other, we would have results such as:
- The difference between Panama and Japan is 1000 - 200 = 800.
- The difference between Japan and Span is 200 - 6 = 194.
This feels inherently wrong - is the gap between Japan and Panama bigger than that between Spain and Japan? I'd say not. Therefore, we use division to find a ratio:
- For a match between Panama and Japan the ratio is: 1000/200 = 5
- For a match between Japan and Span the ratio is 200/6 = 33.3
This has the Spain-Japan gap as bigger than the Japan-Panama one, which feels right. Basically, division will magnify the differences when the scores are low, whilst subtraction magnifies differences when the scores are big. This is why we no longer use goal average.
Creating odds
So... given two teams, we divide one team's coefficient by the others' to help us create their odds of winning the match. Let's take Portugal vs. Serbia:
- Portugal/Serbia = 25.0/150.0 = 0.167
- Serbia/Portugal = 150.0/25.0 = 6
We can see that the better team will have the lower ratio. Comparing these ratios with the odds given for the group stage matches, we get the following graph:
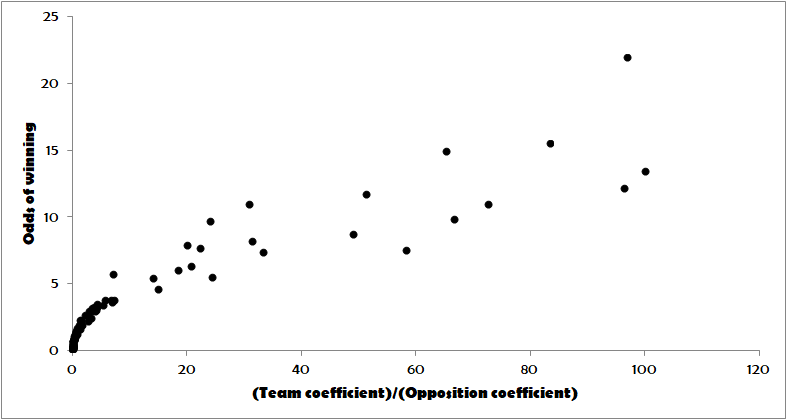
The best equation that describes this relationship is 1.7135R^(0.4623), where R is the coefficient ratio.
To return to our example, this would mean that the odds for Portugal and Serbia would be:
To find the odds of a draw, we perform a similar analysis to get the equation 1.7958R^(0.2114). The only difference here is that R specifically refers to the larger of the two ratios. So, for Portugal vs. Serbia, the larger ratio is Serbia's at 6, so we have:
These odds seem reasonable. Next time we will be using these equations to identify individual matches which appear to have high- (or low-) value odds.
Checking the model
We have a method to create odds, which means the whole tournament can be simulated. But are the results realistic?
To check this, we run the model 3000 times, and tally up each team's performance (e.g. Team A won the tournament x% of the time, they finished runners-up y% of the time, and so on).
We then look at the bookmakers' odds for the teams to reach various stages (e.g. odds of Team A winning the tournament, odds of them reaching the final, etc) - and use our conversion method (detailed last time) to turn them into probabilities.
Comparing our model's predictions versus those of the bookmakers can immediately give an idea of whether our model is realistic. Specifically, we are looking to see whether there is a consistent bias towards stronger or weaker teams. These results (split by round) are shown below. Use the arrow icons to move between the graphs.
To return to our example, this would mean that the odds for Portugal and Serbia would be:
- Portugal = 1.7135 x 0.167^(0.4623) = 0.7484 (approximately odds of 3/4)
- Serbia = 1.7135 x 6^(0.4623) = 3.9230 (approximately odds of 4/1)
To find the odds of a draw, we perform a similar analysis to get the equation 1.7958R^(0.2114). The only difference here is that R specifically refers to the larger of the two ratios. So, for Portugal vs. Serbia, the larger ratio is Serbia's at 6, so we have:
- Draw = 1.7958 x 6^(0.2114) = 2.6228 (approximately odds of 5/2)
These odds seem reasonable. Next time we will be using these equations to identify individual matches which appear to have high- (or low-) value odds.
Checking the model
We have a method to create odds, which means the whole tournament can be simulated. But are the results realistic?
To check this, we run the model 3000 times, and tally up each team's performance (e.g. Team A won the tournament x% of the time, they finished runners-up y% of the time, and so on).
We then look at the bookmakers' odds for the teams to reach various stages (e.g. odds of Team A winning the tournament, odds of them reaching the final, etc) - and use our conversion method (detailed last time) to turn them into probabilities.
Comparing our model's predictions versus those of the bookmakers can immediately give an idea of whether our model is realistic. Specifically, we are looking to see whether there is a consistent bias towards stronger or weaker teams. These results (split by round) are shown below. Use the arrow icons to move between the graphs.
Overall, I am very pleased with how close the points are to the diagonal line (which is where TGIAF and the bookies have made the same prediction). The graph with the biggest discrepancies is the tournament win graph, where the lower-end teams are winning through the simulator less frequently than the bookies predict - but this is negligible, really.
From this, we can conclude that our method of creating odds results in values roughly similar to what would occur in real life, and so we can be fairly confident of the simulator's strengths overall.
Conclusion
The real battle to give odds for teams winning in the knockout rounds is to some up with a measure of strength to compare the sides with. Our initial attempt used the sides' FIFA ranking, but a cursory study of that table shows some unusual rankings, and would have meant that our model would have put Belgium favourites ahead of Spain, Peru favourites ahead of England and Tunisia favourites ahead of Croatia (for example).
Once we found our coefficients, the creation of odds was simply a case of pointing the computer at the data and telling it to do its thing. By checking the results we can have good faith in the results.
 RSS Feed