
by Adrian Worton
Introduction
In the build up to the 2014 World Cup, we have introduced the TGIAF World Cup simulator, and last time we ran the simulator a thousand times in order to get an idea of the probabilities of each team reaching each stage.
Placing our trust into these results, we can compare them to the bookies odds for various events in the tournament and find out which ones are good value to bet on, and which ones should be avoided.
(In our earlier article on odds creation, we have already highlighted a few individual group stage matches which are good and bad value.)
To Qualify from the Group Stages
The first port of call is to see if the bookies' odds for teams to get out of the group stage matches the chances they will qualify using their odds.
Turning the bookies' odds for group qualification into an outright percentage is slightly complicated, so for those calculators see Appendix 1.
We then can compare the probabilities we end up with against the percentage of times each team qualified from its group in our thousand simulations. The result can be seen below:
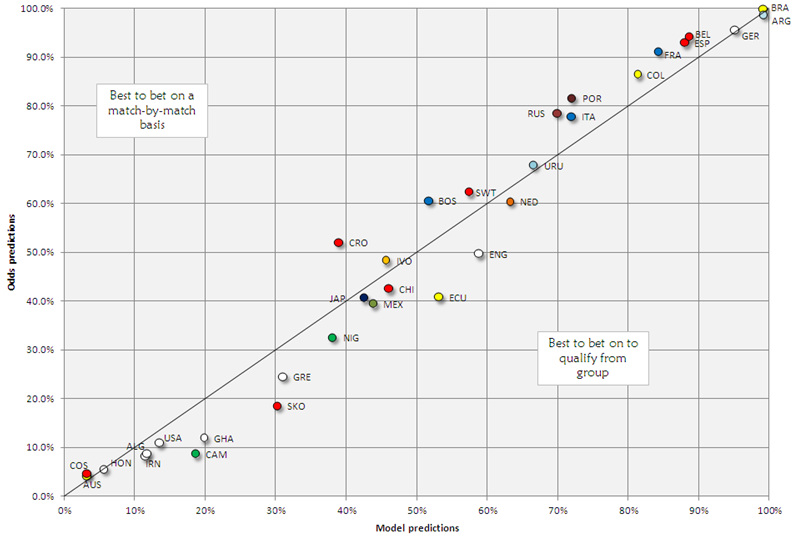
So, sides who appear above the diagonal line appear overvalued by the group qualification odds. This means their individual match odds might be good value. Conversely, those below the diagonal line are the best value to bet on to qualify from their group, as they qualified more times in our simulation than they should do using the group qualification odds. Below you can see more detailed analysis of each group (use the arrow icons to cycle through the groups):
So in summary:
To Win the World Cup
We can now compare how often teams won the World Cup in our simulation (which we showed in detail last time) with the chances the bookies have given them. We used the odds of winning the World Cup, averaged across five bookies, when we created our own odds. We just invert each odd to get a coefficient for each team, which we can then divide by the total of the coefficients to get the overall probability for each team.
Comparing these results to our simulations we get the following:
- The best teams to bet on, on a match-by-match basis: Croatia, Bosnia & Herzegovina, Portugal, Russia, France & Italy (in most cases, the second-favourite in each group).
- The best teams to bet on, to qualify outright from the group: Cameroon, Ecuador, South Korea, England, Greece & Ghana (quite often the third-favourite in each group).
To Win the World Cup
We can now compare how often teams won the World Cup in our simulation (which we showed in detail last time) with the chances the bookies have given them. We used the odds of winning the World Cup, averaged across five bookies, when we created our own odds. We just invert each odd to get a coefficient for each team, which we can then divide by the total of the coefficients to get the overall probability for each team.
Comparing these results to our simulations we get the following:
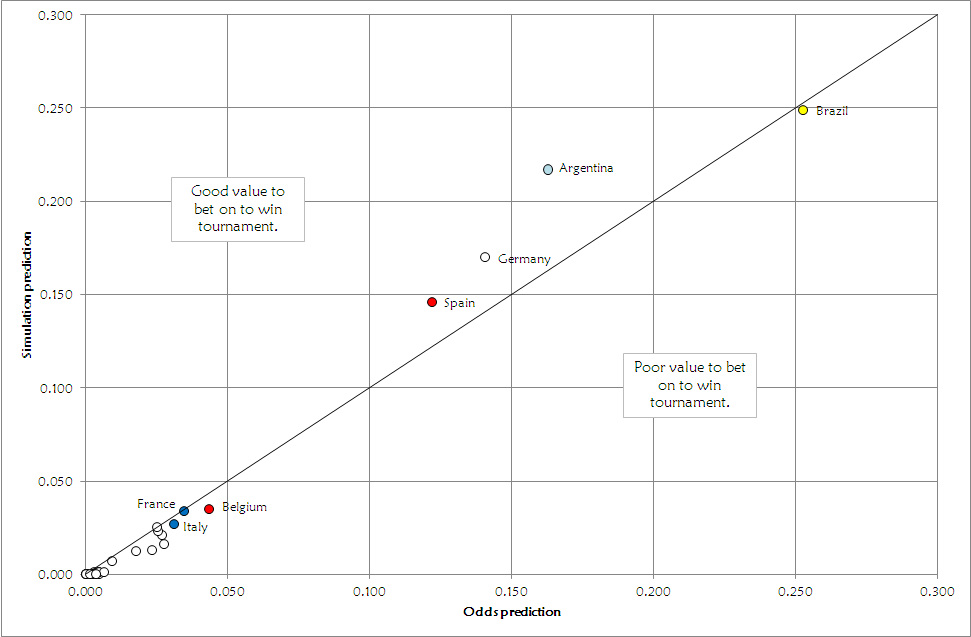
In most cases, it is the favourites which are overvalued by long-term odds, so it is surprising to see three of the four clear favourites for the World Cup, Argentina, Germany and Spain, being the ones who are good value for bets on winning the World Cup, due to a large number of the smaller countries being slightly overvalued. As we saw in our multiple simulation, the "big four" won 79% of the tournaments, however the outright odds only give these four teams a 68% chance of winning, which is quite a big difference.
Stage of Elimination
When we ran our multiple simulation we saw the percentage of times each team reached each round. There are odds available for this, so for each team we can use the same method as before - invert each odd to get a coefficient, and divide each coefficient by the coefficient total to get a percentage. We get the result for each stage, which you can see below:
It is curious to see how the bookies have weighted their odds; because the group stage odds are so significantly undervalued, there is good value to be found in every knockout stage.
Conclusion
Whilst our World Cup simulator started off as a neat novelty, it has become an incredibly powerful tool which can play odds for the same event, but derived in different ways, against each other to find the most rewarding places to bet.
A very solid understanding of probability means that this analysis can lead to a nice profit being made on the World Cup, however, all betting comes with a risk, and bookies are always trying to weight their odds in order to ensure a profit.
Appendix 1 - probabilities of group qualification
For each group, we get the odds given for qualification. So for example, for Group A, the odds are:
We can do as we did with individual match odds, and invert the odds to create a coefficient where a higher coefficient is representative of a better team. If we then divide each coefficient by the total of the four coefficients, we get four values which add up to one:
(The fact that the four odds add to 0.999 is merely down to rounding).
However, these values, despite appearing to be probabilities, do not in fact tell us the probability of each team going through - it tells us the chances of each team going through if there was only one qualification space in the group.
The true probabilities of each team qualifying will add up to 2 (or 200%), since there are two qualification berths. However, we cannot simply double each of these probabilities, as this would push any probabilities over 0.5 (such as Brazil's) beyond 1, or 100%, which is impossible - no matter what post-match interviews might have you believe.
To get the true probabilities we need to consider the possible ways for each team to qualify. So for example, for Croatia, the possible ways are:
The ordering of teams in square brackets don't matter, as in each situation Croatia have already been selected.
We can now find the probabilities of these four situations. For our first situation we just take the value of 0.028 we earlier got for Croatia - the probability of them qualifying if there was only one space available.
For the other three situations, we will take the one with Brazil in 1st as our example. Firstly, there is a 94.% chance of Brazil being selected as the first team. This leaves Croatia with Cameroon and Mexico. We repeat our calculation of dividing each team's coefficient by the total - but this time omitting Brazil - to get the probabilities of each team being selected as the runner-up to Brazil:
Therefore, the chances of Croatia being the runner-up in this situation is 51.9%. So the probability of scenario two occurring is 0.945 x 0.519 = 0.490. The four situations are shown below:
For each group, we get the odds given for qualification. So for example, for Group A, the odds are:
- Brazil: 1/40
- Cameroon: 5/1
- Croatia: 5/6
- Mexico: 11/10
We can do as we did with individual match odds, and invert the odds to create a coefficient where a higher coefficient is representative of a better team. If we then divide each coefficient by the total of the four coefficients, we get four values which add up to one:
- Brazil: 0.945
- Cameroon: 0.005
- Croatia: 0.028
- Mexico: 0.021
(The fact that the four odds add to 0.999 is merely down to rounding).
However, these values, despite appearing to be probabilities, do not in fact tell us the probability of each team going through - it tells us the chances of each team going through if there was only one qualification space in the group.
The true probabilities of each team qualifying will add up to 2 (or 200%), since there are two qualification berths. However, we cannot simply double each of these probabilities, as this would push any probabilities over 0.5 (such as Brazil's) beyond 1, or 100%, which is impossible - no matter what post-match interviews might have you believe.
To get the true probabilities we need to consider the possible ways for each team to qualify. So for example, for Croatia, the possible ways are:
- 1. Croatia; [Brazil, Cameroon, Mexico]
- 1. Brazil; 2. Croatia; [Cameroon, Mexico]
- 1. Cameroon; 2. Croatia; [Brazil, Mexico]
- 1. Mexico; 2. Croatia; [Brazil, Cameroon]
The ordering of teams in square brackets don't matter, as in each situation Croatia have already been selected.
We can now find the probabilities of these four situations. For our first situation we just take the value of 0.028 we earlier got for Croatia - the probability of them qualifying if there was only one space available.
For the other three situations, we will take the one with Brazil in 1st as our example. Firstly, there is a 94.% chance of Brazil being selected as the first team. This leaves Croatia with Cameroon and Mexico. We repeat our calculation of dividing each team's coefficient by the total - but this time omitting Brazil - to get the probabilities of each team being selected as the runner-up to Brazil:
- Cameroon: 0.093
- Croatia: 0.519
- Mexico: 0.389
Therefore, the chances of Croatia being the runner-up in this situation is 51.9%. So the probability of scenario two occurring is 0.945 x 0.519 = 0.490. The four situations are shown below:
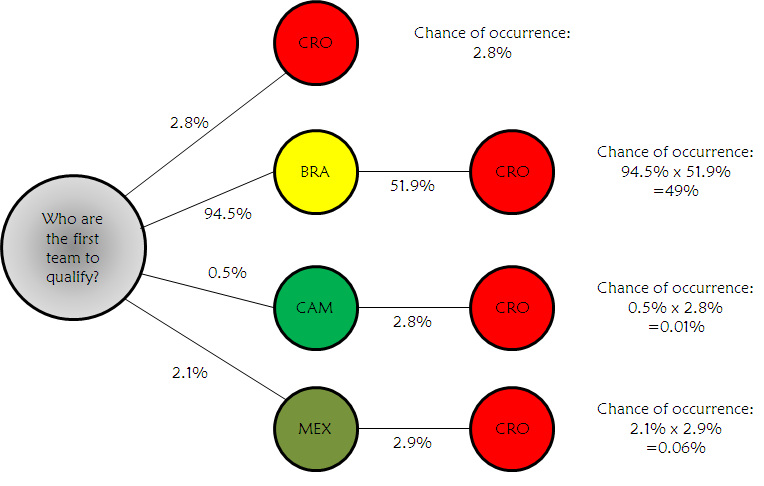
We can then simply add the four probabilities to find the probability of Croatia qualifying:
2.8% + 49% + 0.01% + 0.06% = 51.9%
This is repeated for every team in the tournament to get the following probabilities:
2.8% + 49% + 0.01% + 0.06% = 51.9%
This is repeated for every team in the tournament to get the following probabilities:
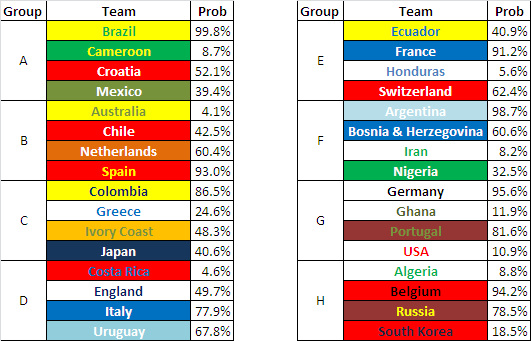
(The difference between Croatia's value here and the one given in our example is due to the rounding used in the example).
 RSS Feed