
by Adrian Worton
Introduction
This week, we have been building up to the creation of our World Cup simulator. Firstly, we showed how odds can be used to weight the random simulation of a match, such that each team has a probability of winning matching its ability. This allows us to simulate all the group matches at the World Cup. However, clearly we don't know the odds for all potential knock-out fixtures, so we also showed how to create a process which allows us to create odds for any two given teams.
This means the mechanisms are all in place for us to create our simulator! In this article we will show how the simulator has been constructed. To download a version of the simulator, see Appendix 1.
An Individual Match
This is just a brief overview of the mechanism for an individual match, for more information see the earlier article on this topic.
Below is the first match in the World Cup.
This is just a brief overview of the mechanism for an individual match, for more information see the earlier article on this topic.
Below is the first match in the World Cup.

For each match a random number is generated, so in this case 0.328784. There are three ranges for the random number to fall into, which determines the result:
In this example, our random number falls between 0 and C1 (0.896) which means our result is a victory for Team 1, which is Brazil.
The Group Stages
- 0 - C1: Team 1 wins
- C1 - C2: Draw
- C2 - C3: Team 2 wins
In this example, our random number falls between 0 and C1 (0.896) which means our result is a victory for Team 1, which is Brazil.
The Group Stages
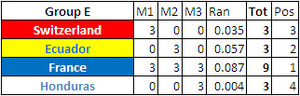
If we simulate the six matches in each group, and add each team's points total, we can work out each team's position. However, in some cases, such as the one on the right, teams might finish level on points; France have won the group, but Switzerland, Ecuador and Honduras are level on three points apiece.
As we are not simulating the score in a match, just the result, we cannot use goal difference to separate teams, and therefore we need a different method. We have simply generated a new random number between 0 and 0.1 to act as our decisive factor. So in our example here, our three random numbers are:
So Ecuador take second place, Switzerland take third, and Honduras finish fourth. It's rare that a group will depend so much on this final random number to separate teams, usually they can be placed easily by points.
The Knockout Rounds
Using our method for creating odds, we can work out C1, C2 and C3 for each knockout fixture. Below is an example of four knockout fixtures.
As we are not simulating the score in a match, just the result, we cannot use goal difference to separate teams, and therefore we need a different method. We have simply generated a new random number between 0 and 0.1 to act as our decisive factor. So in our example here, our three random numbers are:
- Switzerland: 0.035
- Ecuador: 0.057
- Honduras: 0.004
So Ecuador take second place, Switzerland take third, and Honduras finish fourth. It's rare that a group will depend so much on this final random number to separate teams, usually they can be placed easily by points.
The Knockout Rounds
Using our method for creating odds, we can work out C1, C2 and C3 for each knockout fixture. Below is an example of four knockout fixtures.
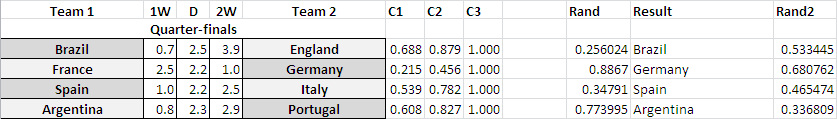
However, we run into a problem, as we cannot have teams draw a knockout fixture, which occurs when our random number (Rand) is between C1 and C2. In our example, this occurs in the Argentina - Portugal match.
To separate teams which have drawn, we have simply generated a second random number (Rand2), and sent Team 1 through if it is below 0.5, and Team 2 through if it is above. In this case, Rand2 = 0.336809, which is below 0.5, so Team 1, Argentina, is sent through.
This 50/50 randomness is a reasonably fair estimation of the lottery of a penalty shootout (we could assume that every team is adopting the optimal strategy for penalty shootouts), however this assumption ignores extra time, where the stronger team is more likely to win. We have ignored this relatively minor issue for now, but it could possibly be rectified by making the probability of a draw occurring slightly smaller.
Conclusion
With the mechanics for group and knockout fixtures in place, the whole simulation can be ran. See Appendix 1 to download a version of the simulator, and see what results follow.
Due to the weighting of matches, the simulations will see stronger teams generally beat weaker opponents, but with scope for upsets. Whilst one simulation might not tell you a lot about what to expect in Brazil this year, multiple simulations will give a much clearer indication.
Appendix 1 - The TGIAF World Cup Simulator
Below is the file containing the simulator, which requires Microsoft Excel to run. Old versions of Excel may not run the file properly.
Below is the file containing the simulator, which requires Microsoft Excel to run. Old versions of Excel may not run the file properly.
| tgiafwcpredictor.xlsm |
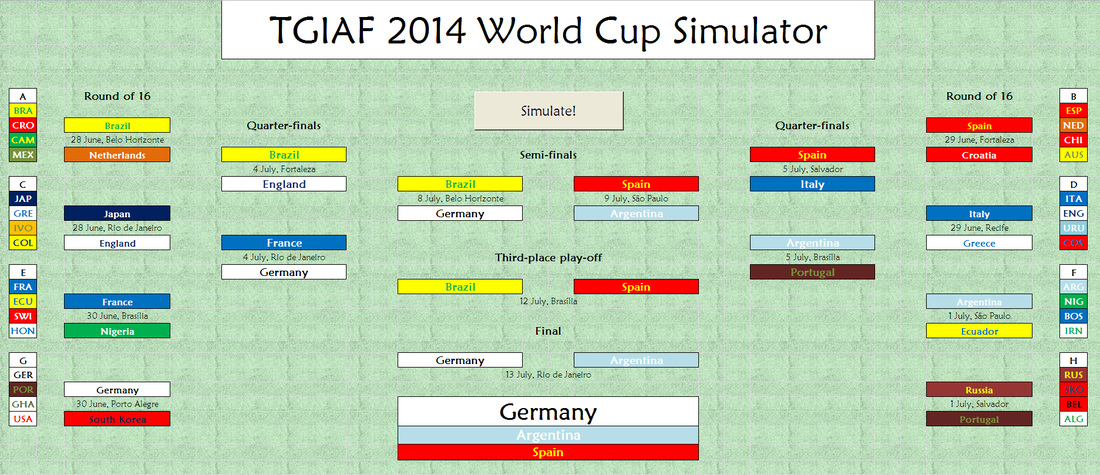
It should appear like the screenshot below. If the simulator is too big for your screen, you can zoom out.
You can use the "Simulate!" button to generate a new set of results, and use the tabs at the bottom to view sheets showing the full results for the group stages, and the knockout rounds.
You can use the "Simulate!" button to generate a new set of results, and use the tabs at the bottom to view sheets showing the full results for the group stages, and the knockout rounds.
 RSS Feed