
by Adrian Worton
Previously, we unveiled the first TGIAF Premiership Simulator, which used odds from bookmakers to generate a season's worth of results. However, we found that our simulator threw up a number of unrealistic outcomes, which could partly be down to unrealistically few victories for favourites.
Previously, we unveiled the first TGIAF Premiership Simulator, which used odds from bookmakers to generate a season's worth of results. However, we found that our simulator threw up a number of unrealistic outcomes, which could partly be down to unrealistically few victories for favourites.
Therefore, we will cut out using odds for the latest simulator, and just focus on the probability a team wins, given its relative strength compared to its opponent.
A version of our new simulator is available to download at the bottom of this document. There is also one embedded on our new Premiership Simulator page, which you don't need to download.
Recalculating the Championship
One of the key ways odds are used within our model was to show that bookies rate points earned in the Championship at 39% of the value as points earned in the Premiership. However, as we are removing odds from our model we will find another way to measure this.
To find our new values, we simply compare the average points per game for teams in their promotion season between 2003/04-2012/13, and their subsequent year in the Premiership.
We find that teams amassed an average of 1.842 points in their promotion seasons, followed by an average of 1.006 in the top flight. Dividing 1.006 by 1.842 gives us 0.546 - this means that we can treat points earned in the Championship as 54.6% of the value of points earned in the Premiership. This significant increase will likely see Burnley, Leicester City and QPR fare better in our new simulator compared to the previous one.
Finding probabilities of victory
Now we have sorted the Championship, we can now look at finding a relationship between the strength of two teams in a match and their probabilities of winning.
Once again, we use the relative form of the two teams are our measure of strength, dividing home form by away form to get a value, which we will call x.
We split our sample of 3800 matches (all matches from the 04/05 season to the 13/14 season) into 100 groups of 38 matches. For each of these groups we work out the proportion of matches which finished in a home win, a draw, and an away win. By plotting these 100 points, we can get an idea of the relationships we need.
We will just consider the probabilities of a home win and an away win - the probability of a draw will just be taken as the remainder. The plots for home and away wins are shown in the slideshow below. Use the arrow icons to navigate between the images.
We can see that for away wins, the slight increase in the final group slightly affects the trend line. Therefore we will say for any value of x higher than 2, the probability of the away team defaults to 0.05, or 5%. And in the unlikely circumstance of an x value below 0.3 the probability will default to 0.8, or 80%.
Similarly, for an x below 0.4 we will set the probability of a home win at 0.1, or 10%. And for an x above 3, the home win probability will be 0.92, or 92%.
For x between 0 and 3.5, the probabilities of the three outcomes are shown below:
Similarly, for an x below 0.4 we will set the probability of a home win at 0.1, or 10%. And for an x above 3, the home win probability will be 0.92, or 92%.
For x between 0 and 3.5, the probabilities of the three outcomes are shown below:
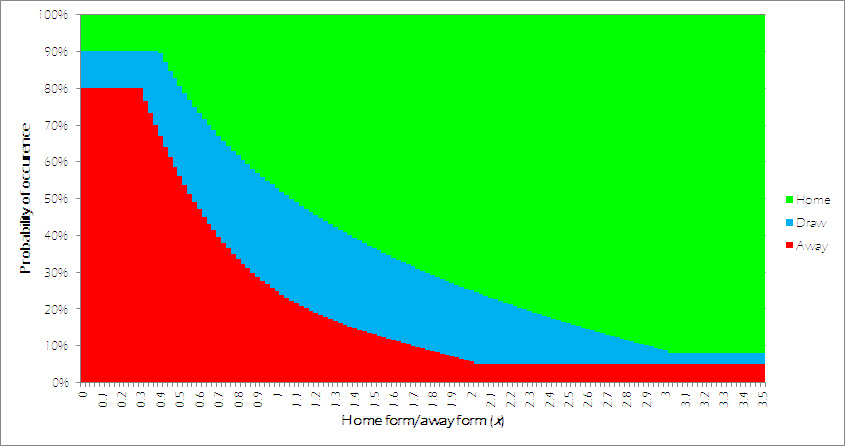
Whilst the areas where we have made the probability default to a set value makes the extremes of this graph look clunky, these are unlikely occurrences and will have a miniscule effect on the final model.
The simulator
With our key mechanisms in place, we can put it all together to make our simulator. Below is a version available to download. To run a new simulation, simply highlight the dark grey cell below the league table and hit the delete key.
The simulator
With our key mechanisms in place, we can put it all together to make our simulator. Below is a version available to download. To run a new simulation, simply highlight the dark grey cell below the league table and hit the delete key.
| tgiafpremulator2.xlsx |
A version is also hosted on our Premiership Simulator page, which doesn't need downloading.
Next time we will assess the output of this new simulator.
Next time we will assess the output of this new simulator.
 RSS Feed