
by Adrian Worton
The magnificent 2014 Commonwealth Games in Glasgow is proving to be very successful for the Home Nations, with Scotland breaking its medal record (both in terms of golds, and total medals) and England looking like they might top the medal table for the first time since 1986 (the last Games to be held in Scotland).
What we want to know is whether success in a Commonwealth Games predicts success in the Olympic Games two years later. To do this we will need to work out how to standardise results in the two competitions.
Our Sample
We will look at the last six "cycles", so the Commonwealth Games from 1990-2010 (Auckland, Victoria, Kuala Lumpur, Manchester, Melbourne, Delhi) and the Olympic Games from 1992-2012 (Barcelona, Atlanta, Sydney, Athens, Beijing, London).
We will focus on the ten countries with the strongest recent record in Commonwealth Games: Australia, Canada, India, Jamaica, Kenya, Malaysia, New Zealand, Nigeria, South Africa and Great Britain. Whilst the British nations compete separately at the Commonwealth Games, they compete as a unified team in the Olympics, so we have added the medal totals to create a total for Great Britain.
For each of the 12 Games, Commonwealth and Olympic, in our sample we take each country's total medal haul.
Standardising the Data
The table below shows the medal hauls for the countries in our sample:
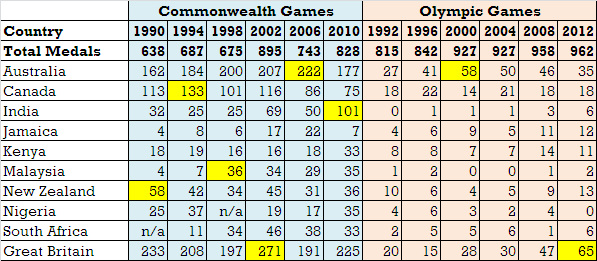
We can see that each Games has a different total number of medals on offer (aside from 2000 and 2004), so for each Games we will take each team's percentage of total medals won. So for example, in the 1990 Games Australia won 162/638 medals, which is 25.4%.
The cells highlighted in yellow indicate a home Games, so for example the 1990 Commonwealth Games was hosted by New Zealand. This presents a small problem, as it is well-recognised that hosting a Games will inflate a team's medal count.
Firstly, for each team who hosted a Games, we will work out their average percentage in those Games, and compare them to the percentage of medals won in home Games. Details of this are in Appendix 1. We find that hosting a Games means a team performs at 148.2% their usual rate when hosting a Games. So in order to rescale our results to account for this, we divide the medals won in home Games by 1.482. The updated medal tallies are shown below:
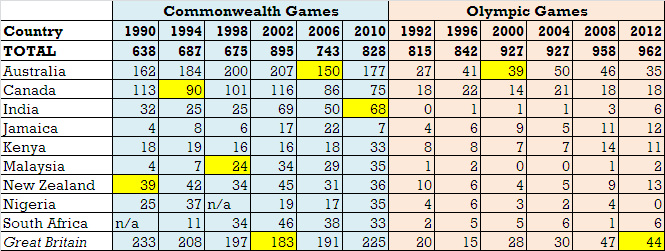
We now want to know how well each team's Games are, relative to the strength of each team. To do this we simply divide each team's medal percentage by the average medal percentage. So, for example, across all six Commonwealth Games Australia average 24.4%, so their results are all divided by this. We know that in Auckland 1990 they won 25.4% of medals, so their performance in Auckland is simply 25.4/24.4 = 1.04, or 104%.
This means we have now neutered the effects of uneven medals being available in different Games, as well as the home nation effect and the strength of each team. Therefore, we have a relative score showing how well a country did in a Games, and can see if a good performance in the Commonwealths precedes a good performance in the Olympics.
Results
Below is a graph plotting performances in the Commonwealth Games versus performances in the Olympic Games. We have excluded Games where a team scored 0 medals (India in 1992, Malaysia in 2000 & 2004, and Nigeria in 2012), as well as Games where teams didn't compete (South Africa in 1990, Nigeria in 1998).
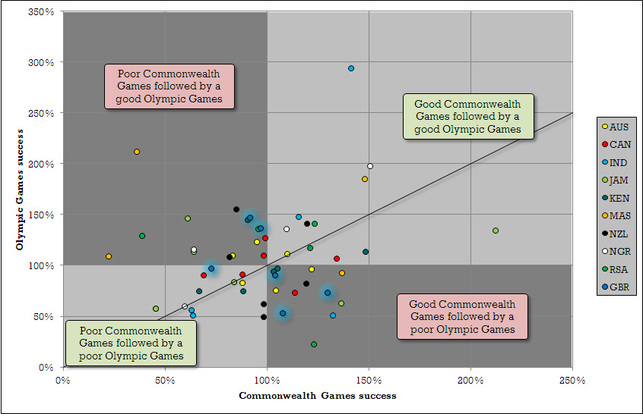
If all (or the vast majority of) our data fell into the light grey boxes, we could conclude that a good performance in the Commonwealths is followed by a good performance in the following Olympics. However, the data seems very randomly spread around the plot, implying there is no relationship at all. Indeed, the R^2 term for this plot is 0.0245, an incredibly low value.
If we look at the results for Great Britain, which are the ones with a blue glow, we can in fact see that there almost seems to be a negative relationship - in that in order to have a good Olympics, they need to have a poor Commonwealth Games. This is bad news for Rio 2016, however, six data points is too small a sample to get such conclusions from.
Conclusion
The Commonwealth Games are almost as effective an indicator of Olympic success as randomly generating numbers. So whilst the optimism for Great Britain is high following the performance in Glasgow this year, we are still none the wiser.
Appendix 1 - the effect of home Games
In our sample we have six host nations (over the six Commonwealth Games, plus the Sydney 2000 and London 2012 Olympics). Below are the average medal percentages for each host team, depending on the Games:
In our sample we have six host nations (over the six Commonwealth Games, plus the Sydney 2000 and London 2012 Olympics). Below are the average medal percentages for each host team, depending on the Games:
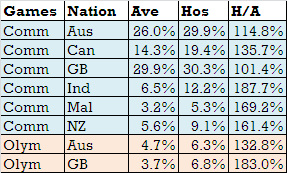
The Ave column is the average percentage of medals won in that type of Games, the Hos column is the percentage of medals won in the hosted Games, and H/A is simply Hos/Ave, showing the percentage increase made from the usual success level by hosting the Games.
The average percentage increase is 148.2%, showing that a team wins an extra 48.2% more in a home Games than they would away.
The average percentage increase is 148.2%, showing that a team wins an extra 48.2% more in a home Games than they would away.
 RSS Feed