by Adrian Worton
Introduction
Earlier this week, we showed how to simulate football matches, weighting the results using bookies' odds. This is part of the World Cup simulator that we are slowly building up to.
Using pre-existing odds is a great way of simulating matches. However, this will only take us to the end of the group stages of the World Cup, because clearly the knock-out fixtures haven't been drawn yet.
Therefore, in order to be able to simulate the entire tournament, we need to be able to create odds for any possible knock-out fixture. Here we explore a possible way of creating odds.
Finding Team Strengths
We will be using the odds we already know, from the 48 group matches, to come up with equations which will predict odds between teams in the knock-out rounds. However, odds are dependent on both teams; clearly, the odds on (for example) Brazil to win a match will differ depending on who their opponent is. Therefore, we need to be able to compare the strengths of the two teams in order to find a relationship to predict odds with.
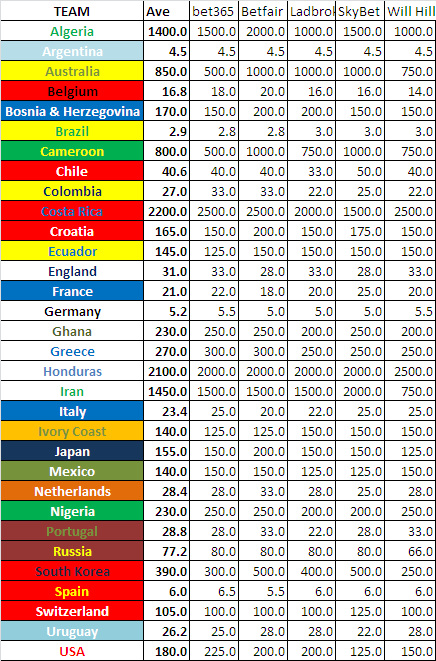
As with our previous analysis, we can use pre-existing odds rather than analysing teams' form, since the bookies will have put far more resources into the creation of their odds than we would be able to easily do. Therefore, we have taken the average odds of each side winning the World Cup across five leading bookies (bet365, Betfair, Ladbrokes, SkyBet and William Hill) to come up with a coefficient for each team, where the lower the better.
So for example, Algeria's five odds are 1500/1, 2000/1, 1000/1, 1500/1 and 1000/1, the average of which is 1400/1 (which we have decimalised, so it becomes 1400.0). Meanwhile, Argentina's odds are 9/2 with all five bookies, so their coefficient is simply 4.5. To see the full workings for each nation, see Appendix 1.
Finding a Trend
We can now look to find a relationship to predict the odds of a given team winning its match. To get a measure of the strength of a team compared to its opponent, we divide its coefficient derived in the section above by its opponent's. So for example, if Algeria were playing Argentina, we would divide Algeria's 1400 by Argentina's 4.5 to get a value of 311.11. Again, the better a team is compared to its opponent, the lower this value will be. So for Argentina, their coefficient would be 4.5/1400 = 0.003 if they faced Algeria.
We can now see the relationship between this measure of comparative strength and the odds of a team winning, using the group stage matches:
Finding Team Strengths
We will be using the odds we already know, from the 48 group matches, to come up with equations which will predict odds between teams in the knock-out rounds. However, odds are dependent on both teams; clearly, the odds on (for example) Brazil to win a match will differ depending on who their opponent is. Therefore, we need to be able to compare the strengths of the two teams in order to find a relationship to predict odds with.
As with our previous analysis, we can use pre-existing odds rather than analysing teams' form, since the bookies will have put far more resources into the creation of their odds than we would be able to easily do. Therefore, we have taken the average odds of each side winning the World Cup across five leading bookies (bet365, Betfair, Ladbrokes, SkyBet and William Hill) to come up with a coefficient for each team, where the lower the better.
So for example, Algeria's five odds are 1500/1, 2000/1, 1000/1, 1500/1 and 1000/1, the average of which is 1400/1 (which we have decimalised, so it becomes 1400.0). Meanwhile, Argentina's odds are 9/2 with all five bookies, so their coefficient is simply 4.5. To see the full workings for each nation, see Appendix 1.
Finding a Trend
We can now look to find a relationship to predict the odds of a given team winning its match. To get a measure of the strength of a team compared to its opponent, we divide its coefficient derived in the section above by its opponent's. So for example, if Algeria were playing Argentina, we would divide Algeria's 1400 by Argentina's 4.5 to get a value of 311.11. Again, the better a team is compared to its opponent, the lower this value will be. So for Argentina, their coefficient would be 4.5/1400 = 0.003 if they faced Algeria.
We can now see the relationship between this measure of comparative strength and the odds of a team winning, using the group stage matches:
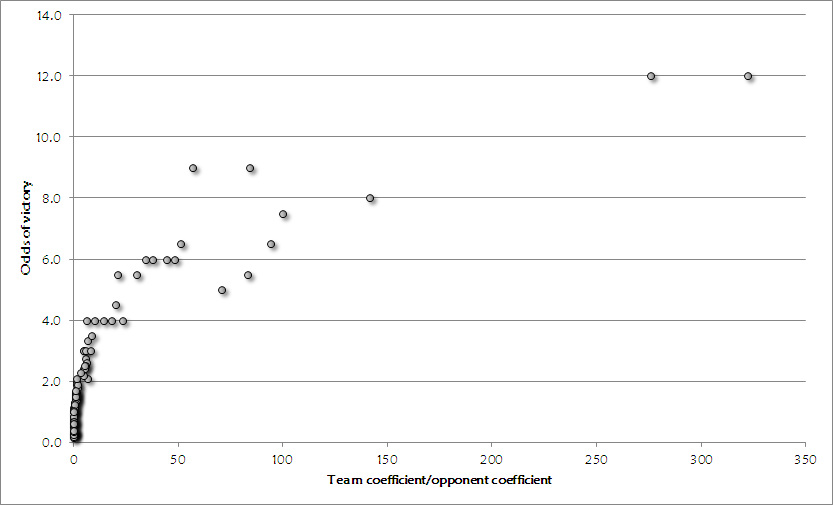
This data is hard to analyse, due to a lot of the data being largely concentrated at the lower end of the scale, with a few significant outliers. Therefore, we can split the graph into parts, and find a rule for each section.
Firstly, it seems that for our largest outliers (which happen to be Cameroon against Brazil, and Iran against Argentina) the odds default to 12/1. Therefore we can set a simple rule for matches like this - as soon as a team's coefficient is more than 250 times larger than their opponent, their odds are automatically 12/1.
We can split our data into the following groups:
For groups 2, 3 and 4, a power trend line (calculated by Microsoft Excel) provided the best fit for the data due to the curved nature of the relationship. Below are all three groups, and the trend line found for each one. Use the thumbnails on the right to navigate through the different graphs.
Firstly, it seems that for our largest outliers (which happen to be Cameroon against Brazil, and Iran against Argentina) the odds default to 12/1. Therefore we can set a simple rule for matches like this - as soon as a team's coefficient is more than 250 times larger than their opponent, their odds are automatically 12/1.
We can split our data into the following groups:
- When a team's coefficient is over 250 times larger than their opponent's.
- When their coefficient is between 10-250 times larger than their opponent's.
- When their coefficient is between 1-10 times larger than their opponent's.
- When their coefficient is are smaller than their opponent's.
For groups 2, 3 and 4, a power trend line (calculated by Microsoft Excel) provided the best fit for the data due to the curved nature of the relationship. Below are all three groups, and the trend line found for each one. Use the thumbnails on the right to navigate through the different graphs.
After a tiny bit of rounding, our rules to calculate the odds of a team winning for our four groups are:
The same technique is used to find the odds that a side will draw its match (for details, see Appendix 2). This gives us the follow four rules:
Because these rules are just estimations, it is likely that you can end up with two different odds for a draw, depending on which team's coefficient you divide by their opponent. Therefore, the simplest solution is to find both values and take an average.
An Example
It is probably easier to see how this process works by going through an example. Choosing a group match at random, we get Portugal vs Ghana.
Portugal's coefficient is 28.8, whilst Ghana's is 230. Dividing the former by the latter gives Portugal a value of x = 0.125, whilst Ghana's value is x = 230/28.8 = 7.986. This places Portugal in group 4, and Ghana in group 3.
So, using our rules for group 4, Portugal's odds for a win are 1.65(0.125^0.3697) = 0.76, and their odds for a draw are 1.87(0.125^(-0.131)) = 2.46. Using the rules for group 3, Ghana's win odds are 1.55(7.986^0.3407) = 3.15, and their odds for a draw are 2.05(7.986^0.0467) = 2.26. The average of our two draw odds is 2.36.
In reality, the odds for this fixture are:
Therefore in this case, our estimation is relatively close. We can do this for all group matches to see how our model performs.
Comparing the Model to Real Life
The graph below shows how our predictions fare. Data points above the diagonal line show matches where our prediction is higher than the actual odds, and below the line shows the opposite. The closer to the diagonal line a point is, the better the prediction is.
- 12.0
- 2(x^0.2834)
- 1.55(x^0.3407)
- 1.65(x^0.3697)
The same technique is used to find the odds that a side will draw its match (for details, see Appendix 2). This gives us the follow four rules:
- 4.5
- 1.58(x^0.175)
- 2.05(x^0.0467)
- 1.87(x^(-0.131))
Because these rules are just estimations, it is likely that you can end up with two different odds for a draw, depending on which team's coefficient you divide by their opponent. Therefore, the simplest solution is to find both values and take an average.
An Example
It is probably easier to see how this process works by going through an example. Choosing a group match at random, we get Portugal vs Ghana.
Portugal's coefficient is 28.8, whilst Ghana's is 230. Dividing the former by the latter gives Portugal a value of x = 0.125, whilst Ghana's value is x = 230/28.8 = 7.986. This places Portugal in group 4, and Ghana in group 3.
So, using our rules for group 4, Portugal's odds for a win are 1.65(0.125^0.3697) = 0.76, and their odds for a draw are 1.87(0.125^(-0.131)) = 2.46. Using the rules for group 3, Ghana's win odds are 1.55(7.986^0.3407) = 3.15, and their odds for a draw are 2.05(7.986^0.0467) = 2.26. The average of our two draw odds is 2.36.
In reality, the odds for this fixture are:
- Portugal win = 0.75
- Draw = 2.5
- Ghana win = 3
Therefore in this case, our estimation is relatively close. We can do this for all group matches to see how our model performs.
Comparing the Model to Real Life
The graph below shows how our predictions fare. Data points above the diagonal line show matches where our prediction is higher than the actual odds, and below the line shows the opposite. The closer to the diagonal line a point is, the better the prediction is.
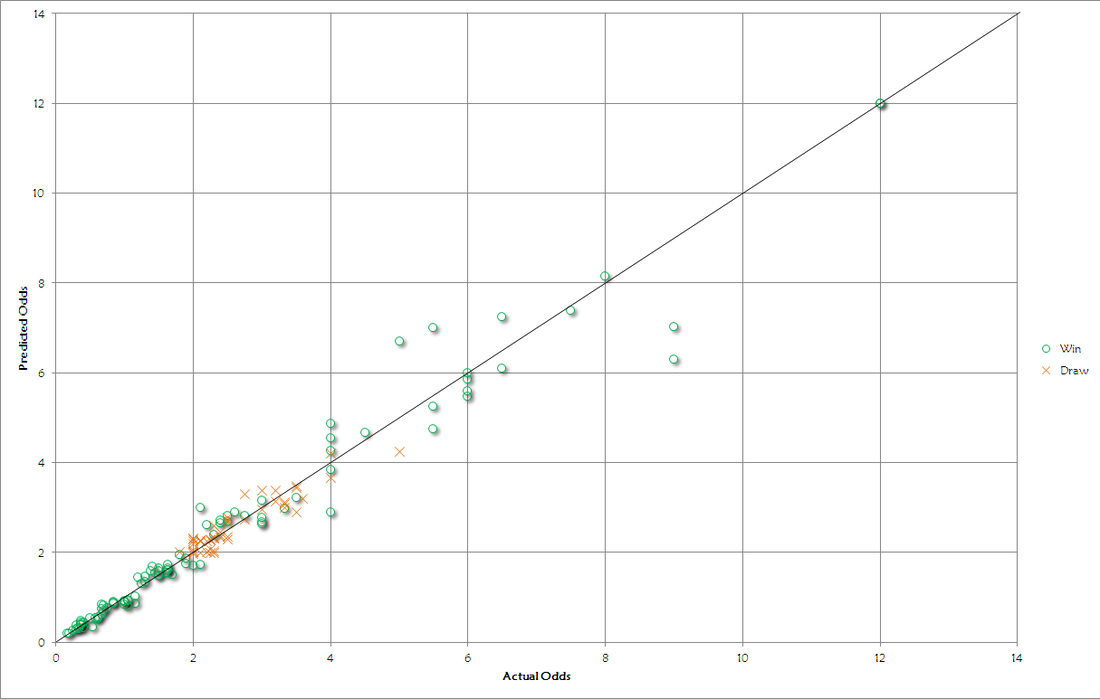
Clearly the vast majority of points are very close to the diagonal line, showing that our model estimates odds very well.
The matches around the centre of our graph which stray from the line are not necessarily a failure of our model, it could be an indication of matches where the bookies have over or underestimated a side's chances of winning. If this is the case, these are the matches to take notice of:
Clearly, these matches all feature outsiders, so it is likely that all four teams will fail to win anyway, but they are definitely worth keeping an eye on.
Summary
Our method for producing odds for a given match at the World Cup runs smoothly, and we can confidently use it to fill in the odds for the knockout matches in our simulator.
Due to the high reliability of our model, it is not necessarily clear if the differences between this and the real-life odds are a result of flaws in the model, or oversights by the bookies. Therefore, there is a possibility that this model can suggest which matches have the highest chance of bringing in a profit through savvy betting.
Sources
Odds for each team to win the World Cup are taken from bet365, Betfair, Ladbrokes, SkyBet and William Hill. The odds for each group stage match were taken solely from SkyBet.
Appendix 1 - Team Coefficients
The matches around the centre of our graph which stray from the line are not necessarily a failure of our model, it could be an indication of matches where the bookies have over or underestimated a side's chances of winning. If this is the case, these are the matches to take notice of:
- The odds for Croatia to beat Brazil and Costa Rica to beat Uruguay are significantly higher than they should be, so a small bet on these might be worthwhile.
- The odds for Costa Rica to beat England and Algeria to beat Belgium are significantly lower than they should be, so avoid betting on these.
Clearly, these matches all feature outsiders, so it is likely that all four teams will fail to win anyway, but they are definitely worth keeping an eye on.
Summary
Our method for producing odds for a given match at the World Cup runs smoothly, and we can confidently use it to fill in the odds for the knockout matches in our simulator.
Due to the high reliability of our model, it is not necessarily clear if the differences between this and the real-life odds are a result of flaws in the model, or oversights by the bookies. Therefore, there is a possibility that this model can suggest which matches have the highest chance of bringing in a profit through savvy betting.
Sources
Odds for each team to win the World Cup are taken from bet365, Betfair, Ladbrokes, SkyBet and William Hill. The odds for each group stage match were taken solely from SkyBet.
Appendix 1 - Team Coefficients
Appendix 2 - Draw Odds Calculations
For our group 1, we took the general rule that the odds of a draw should be equal to 4.5, as this is the average of the two matches to fall in this range. For the other groups, see below.
For our group 1, we took the general rule that the odds of a draw should be equal to 4.5, as this is the average of the two matches to fall in this range. For the other groups, see below.
 RSS Feed