by Adrian Worton
Earlier this week our General Election simulator was updated with the latest odds, and we can now play around with the parameters within the model in order to see which parties are going to be the most influential in deciding the next Prime Minister.
Earlier this week our General Election simulator was updated with the latest odds, and we can now play around with the parameters within the model in order to see which parties are going to be the most influential in deciding the next Prime Minister.
The charts below show how close the gap between the two main parties has become.
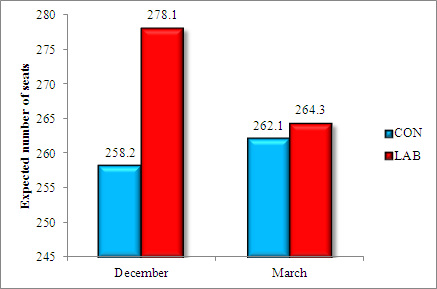 |  |
On the left is the expected number of seats (the calculation behind which is on this previous article), where we see Labour's lead cut down from a large 19.9 seats to a meagre 2.2.
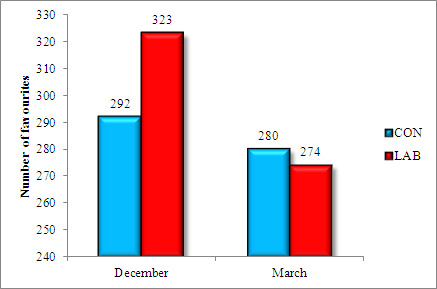
The graph on the right is a count of how many seats each party is favourite in, and here we see the Conservatives actually overtake Labour, despite a drop in their own seat count.
Most election predictions will just use the latter calculation - i.e. see who is favourite in each seat, and say they will win it. However, when applied to so many constituencies, this method becomes quite stretched. For example, if a party has a 55% chance of winning in 20 different seats, this method suggests they will win all 20. However, if the original probability is correct, they will only be likely to win 55% of these - i.e. 11. This is quite a substantial difference, and therefore we will just be studying the effect on the expected seat count.
Method
Firstly, we will just be looking at the seven biggest parties in Britain - Conservatives, Greens, Labour, Liberal Democrats, Plaid Cymru, SNP and UKIP - as none of the other parties are standing in enough seats to make a substantial difference to the model. The Northern Irish parties are excluded as neither Labour nor the Conservatives have a high chance of winning any seats there.
Looking at each party in turn, we will apply a multiplier to their odds. For example, if the multiplier is 1.1, then this particular party will increase by 10% in every constituency they stand in. We can then see how much each party's odds need to be increased or decreased in order to swing our leading party from Labour to the Conservatives.
Results
Below is a slideshow showing the results for each party (use the arrow icons to move between images). The red line indicates Labour seats, the blue line indicates Conservative seats. The steeper a line is, the stronger the relationship between the two parties.
Unfortunately, going by the output from our previous article (which can be seen on the right),
We will go through the results for each party. The critical value is the percentage increase/decrease needed to switch the lead to David Cameron's party. Clearly, the lower the percentage the more influence that party has.
Conservatives - obviously, the Conservatives need to increase their performance to wrest control of the race. The critical value for them is 2.8%.
Greens - the steeper red line indicates the Greens are competing more with Labour than the Conservatives for their seats. Therefore, an increase in Green performance is needed. However, it is a huge leap needed, with the critical value being 318%.
Labour - very similar to their rivals, but in the other direction, Labour need to decrease by 2.7% to lose the lead.
Liberal Democrats - it might be initially unclear which party the Lib Dems most affect, but we can see that the steeper line indicates that it is the Conservative party. Subsequently, a decrease of 32.6% is their critical value.
Plaid Cymru - with Labour generally outperforming the Conservatives in Wales, it is no surprise that improvements in Plaid performance affects Labour more. However, as with the Greens, a massive increase is needed for Leanne Wood's party to be decisive, with their critical value being 726%.
SNP - despite repeated Conservative barbs aimed at the Scottish nationalists, an increase in their performance would increase the chances of a second Cameron term, which isn't surprising, as Labour are far more established in Scotland than the Conservatives. A relatively low increase of 29% is the SNP's critical value.
UKIP - for a party with a large proportion of ex-Conservative candidates and donors, it is unsurprising that they are also competing for voters and seats. Therefore the Conservatives need UKIP's performance to dwindle by May, with the critical value being a decrease of 53.9%.
Conclusion
The first thing to mention is that our method assumes independence between party voters, meaning that an increase in one party performance will affect all others equally. However, this is far from the truth, as some paths between parties are far more trodden than others. For example, more voters will move between the Liberal Democrats and Labour than will between the SNP and the Conservatives, because these parties are closer on the political spectrum.
This means that the exact values of our critical values are largely meaningless. However, this doesn't mean that our tests has been meaningless, because the relative values between parties will still be accurate. In other words, we know that changes in the SNP performance before May will affect the election outcome more than the performance by Plaid.
So we know that in order for Labour to hang onto their top spot, they need:
- Liberal Democrat and UKIP to gain in strength
- The Greens, Plaid and the SNP to weaken
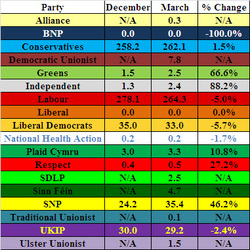
Unfortunately, according to the output of our previous article (which can be seen on the right), this is the exact opposite of the current momentum these parties have.
However, an even bigger lesson can be learned by the fact that the critical values for both the Conservatives and Labour are (inevitably) significantly lower than all other parties. Therefore, what the strategists from each party should take away from this is that instead of focusing on Alex Salmond billboard and anti-Green units, positive campaigning on the benefits of their own parties has a higher reward rate.
However, an even bigger lesson can be learned by the fact that the critical values for both the Conservatives and Labour are (inevitably) significantly lower than all other parties. Therefore, what the strategists from each party should take away from this is that instead of focusing on Alex Salmond billboard and anti-Green units, positive campaigning on the benefits of their own parties has a higher reward rate.
General Election articles
Previous: General Election Simulator - March Update
Next: Target Seats - Labour
Previous: General Election Simulator - March Update
Next: Target Seats - Labour
 RSS Feed