by Dr Adrian Worton
In this article we are going to take a departure from looking specifically at our General Election model, which is based on bookies’ odds, and instead look at the numbers from the previous election.
Specifically, we are going to consider the vote share. By building a very simple model using the 2015 election, we can estimate how many seats each party will get in 2017 for various scenarios. You can find an editable version of this model in the Appendix at the end of this article.
The model
Firstly, we have collected the full set of votes for each constituency in 2015. By summing up each party’s votes, we get the following vote shares:
CON 36.9%; LAB 30.4%; UKIP 12.6%; LIB 7.9%; SNP 4.7%; GRE 3.8%; DUP, PLA, SIN 0.6%; UUP 0.4%; SDLP 0.3%; ALL 0.2%; TUV 0.1%; other 0.9%
You will note that this list includes the national vote share of regional parties, which isn’t ideal. For example, the 4.7% vote share the SNP received was actually 50.0% of votes in Scotland. However, as this is how the results from polls are usually reported, this is the format we will use.
We now want to adapt each party’s votes for a new vote share. For example, say we want to change the Conservative vote share to 40%. We will simply go through each seat and multiply the Conservative vote by 40/36.9. In other words, we use this formula:
votes x ([new vote share]/[2015 vote share])
This means that the votes earned by a particular party in separate seats stay relative to each other. So, if a party received 100 votes in Seat A and 200 votes in Seat B, then no matter what their new vote share becomes, then they will have twice the votes in Seat B.
This is a simplifying assumption. It will hold reasonably well - it is unlikely we will see parties hugely changing their vote base from two years ago - however of course there will be some local factors that this doesn’t take into account. However, it should be enough for us to get a rough idea of what we might expect.
Don't forget - there is an interactive version of the model for you to test at the bottom of this article.
What are the polls currently projecting?
This means we can throw the latest opinion polls into our model and see what this translates to in terms of seats. We’ll use the latest polls by five of the main pollsters (using the BBC poll tracker). Their results were as follows:
Note that most polls only give the vote share for the larger parties. For the other parties we take the remaining share and split it in the same ratio as they gained votes in 2015. Putting these vote shares into our model gives the following seat counts:
This is a simplifying assumption. It will hold reasonably well - it is unlikely we will see parties hugely changing their vote base from two years ago - however of course there will be some local factors that this doesn’t take into account. However, it should be enough for us to get a rough idea of what we might expect.
Don't forget - there is an interactive version of the model for you to test at the bottom of this article.
What are the polls currently projecting?
This means we can throw the latest opinion polls into our model and see what this translates to in terms of seats. We’ll use the latest polls by five of the main pollsters (using the BBC poll tracker). Their results were as follows:
- Opinium (25th May): CON 45%; LAB 35%; LIB 7%; SNP, UKIP 5%; GRE 2%
- ICM (26th May): CON 46%; LAB 32%; LIB 8%; UKIP 5%; GRE 2%
- ComRes (26th May): CON 46%; LAB 34%; LIB 8%; UKIP 5%; SNP 4%; GRE 2%
- YouGov (26th May): CON 43%; LAB 36%; LIB 9%; UKIP 4%
- Survation (27th May): CON 43%; LAB 37%; LIB 8%; UKIP 4%; SNP 2%; GRE 1%
Note that most polls only give the vote share for the larger parties. For the other parties we take the remaining share and split it in the same ratio as they gained votes in 2015. Putting these vote shares into our model gives the following seat counts:
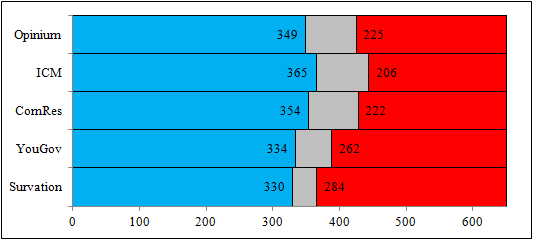
The interesting thing to note from this is that the Conservatives have a strong lead in terms of seats, but it isn’t as close to 400 as other predictions have suggested, nor indeed as our model suggested a few weeks ago. Similarly, predictions have had Labour struggling to make 200 seats. It should be noted, by the way, that our previous model results was based on older odds, before the recent Labour bounce in the polls. Speaking of which...
What if Labour draw level?
Some recent polls have given Labour as much as a 15 point swing over the past month. With the Conservative lead somewhere around 7-12%, it is not impossible that Labour will draw level at some point (although it is still highly unlikely). So what would happen if the two parties polled dead level?
Well, it depends where the parties draw level. It could be that Labour makes up the entire gap to reach around 45%, whilst the Conservatives stay static. Alternatively, the Conservatives could lose their lead, and meet Labour at around 37%. To see what happens for a variety of scenarios, we set the Conservatives and Labour equal on vote shares between 30-50%. We can see the result of this below.
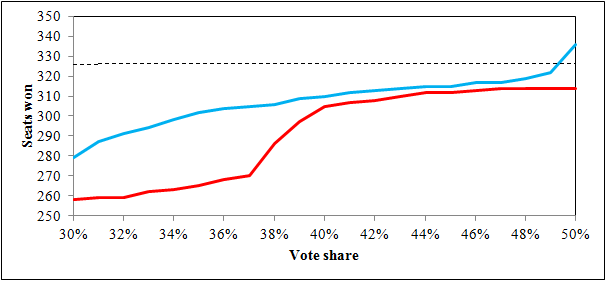
The fascinating result from this is that even though the two parties receive the same number of votes, at no point does Labour receive more seats than their rivals. This is, of course bad news for Labour; that even if they close the substantial gap in the polls, they wouldn’t actually receive an equal number of seats as the Conservatives (we will see why below).
The good news for Labour is that if they are able to close the gap, it is highly unlikely that the Conservatives will be able to form a majority. As most other parties are probably more likely to work with Labour, this means that they would be best-placed to form a government if the votes were tied. This further demonstrates the need for Labour to extend olive branches to other parties, something we looked at in-depth previously when considering a Progressive Alliance.
With Labour currently polling somewhere between 32-38% and the Conservatives polling somewhere between 42-46%, it is of course likely that if they were to poll equally, it would be somewhere roughly between 35-45%.
Why do the Conservatives always lead?
On first look, it seems odd that despite the Conservatives and Labour receiving an equal number of votes, it is always May’s party which has the lead in terms of seats, regardless of the vote share. So let’s sift through the model to see why this is the case. For this test, we are going to use the hypothetical scenario that both the Conservatives and Labour receive 37% of the vote, as this resulted in a sizeable Conservative seat lead, with 305 to Labour’s 270. We’ll call this the 37-37 scenario.
Of course, with first-past-the-post, it is as much about how efficiently your votes are spread as about how many you receive. (On a side note, if you would like to know more about the downsides to FPTP, then we looked at how it compares to proportional voting methods in the wake of the 2015 vote.) So we can look at the spread of each party’s votes by placing them into a histogram, which you can see below. Use the arrow icons to cycle between the histograms.
Each column gives the number of constituencies in our 37-37 scenario which have received the number of votes on the x-axis. The spike on 0 for Labour is due to them not fielding candidates in Northern Ireland.
We can see that both parties have a roughly bimodal (two peaks) distribution, with peaks at roughly 10,000 and 25,000 votes. However, the Labour distribution extends further, with a handful of seats receiving more than 40,000 votes, something that none of the Conservative seats do. For context, 25,000 votes is enough to win all but two seats. So that is potentially quite a lot of Labour votes wasted on creating huge majorities in safe seats. The average Conservative majority is 12,913, whilst Labour’s is 13,657, so this might be part of Labour’s problem.
We can also look at how many votes party receives in defeat. On average, the Conservative vote in a seat they didn’t take was 10,103, whilst Labour’s was 11,985. So this also goes to explain why Labour don’t have the same number of seats, as they often lose with a large number of votes.
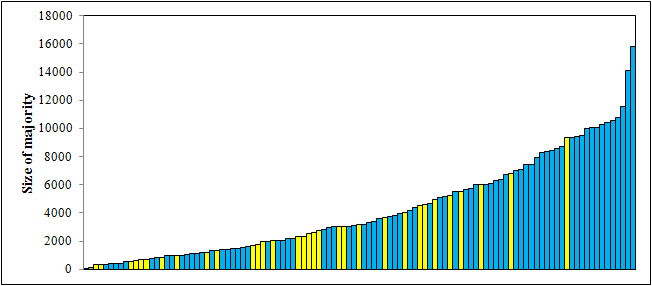
To check this, we can re-draw the above histograms, but splitting the seats into those which each party won, and those which it lost (in grey):
We can see that both parties have a roughly bimodal (two peaks) distribution, with peaks at roughly 10,000 and 25,000 votes. However, the Labour distribution extends further, with a handful of seats receiving more than 40,000 votes, something that none of the Conservative seats do. For context, 25,000 votes is enough to win all but two seats. So that is potentially quite a lot of Labour votes wasted on creating huge majorities in safe seats. The average Conservative majority is 12,913, whilst Labour’s is 13,657, so this might be part of Labour’s problem.
We can also look at how many votes party receives in defeat. On average, the Conservative vote in a seat they didn’t take was 10,103, whilst Labour’s was 11,985. So this also goes to explain why Labour don’t have the same number of seats, as they often lose with a large number of votes.
To check this, we can re-draw the above histograms, but splitting the seats into those which each party won, and those which it lost (in grey):
From these graphs, we can see that the grey area is much higher for Labour in the key area of 15,000-25,000, demonstrating that there are lot of constituencies where Labour poll reasonably well, but just not well enough to take the seat.
We can focus on these seats. The graph below shows which party Labour lost to, and the size of the majority, for any seat where they polled between 15,000-25,000 but lost within the 37-37 model.
We can focus on these seats. The graph below shows which party Labour lost to, and the size of the majority, for any seat where they polled between 15,000-25,000 but lost within the 37-37 model.
We can see that the majority (76) of these seats are taken by the Conservatives, with 32 taken by the SNP. The bad news for Labour is that, no matter their vote share, if they are equal with the Conservatives then they will also be behind them on these.
As for the seats in Scotland, Labour are unlucky in that they are stronger in Scotland than the Conservatives (24.3% of the vote compared to 14.9%), but due to SNP dominance they are seeing a lot of votes wasted.
Summary
Our method for converting vote share into seat predictions is very rudimentary compared to the methods used by proper psephologists. However, it does give us a chance to see what seat numbers we would expect to see for the numbers predicted by polls.
By using recent poll data, we see that a Conservative landslide might not be of the overwhelming scale that has been predicted. If time permits, we might return to this theme to see why there are differences between models.
With Labour's recent bounce in the polls, we can see what we can expect to happen if the two parties were to poll dead level. Regardless of their vote share, if Labour get the same number of votes as the Conservatives then they appear likely to have fewer seats. This appears to be down to a number of factors, such as the fact that Labour have an unfortunately-distributed set of votes.
However, this model is assuming zero deviation from the ratios we saw in 2015, and in fact with some small fluctuation, it might end up being that Labour pip the Conservatives in enough seats to gain a seat lead.
Regardless, it appears that neither party would be able to form a majority. This situation is more likely to suit Labour, as the likely powerbrokers would be the SNP, who would be far more likely to support a Labour-led government.
Appendix - the Vote Share Model
Below you can try out our Vote Share Model. If you type a percentage into the 'Vote share' column, then the number of seats for each party will recalculate based on the method outlined above.
If you type 'same' into the cells, then that party's vote share will remain the same as in 2015, relative to other 'same' parties.
 RSS Feed