by Dr Adrian Worton
With a new General Election on the way, we have been freshening up our model for the new campaign. With only half of the seats initially available, we could only provide tentative early predictions.
We followed this up be previewing Northern Ireland, Wales and Scotland, as all the data was available for these. Now, finally, we have a full model to unveil!
In this article we'll go through a bit of background, before giving our first predictions.
Collecting data
Our data, as always, comes from bookmaker odds. Unusually, all bookmakers have been very slow to gather odds for all constituencies, hence our slow unveiling of this model. To maximise the number of seats in our model, we have taken odds from as many different bookmakers as possible.
Occasionally, our automated collection method has highlighted some strange odds - such as that with Vale of Glamorgan found in our Wales article. We have tried to manually correct these; if you notice any more please drop a comment below to let us know.
As mentioned, the bookmakers have been slow to unveil all constituencies, and in fact we are only up to 645 (out of 650). Of the remaining five, one is Chorley, the seat where the new Speaker of the House (Lindsay Hoyle) is standing. By convention major opposition parties do not stand against the Speaker, and no Speaker has lost their seat. Therefore, we have given Hoyle (counted as an Independent) very short odds for his seat, similar to those given to John Bercow in the last election.
The remaining four seats are Stockton North, Tonbridge & Malling, Waveney and Wealden. To find odds for these we build a little tool that showed the seats with the closest vote shares for any given seat. For example, these were the results for Stockton North:
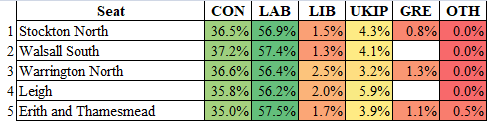
Therefore, we simply took the odds from Walsall South to represent Stockton North. Checking this method for seats where we do know the odds suggest this is a reasonably accurate step to take.
Therefore, we have been able to get odds for all 650 seats.
Expected seat counts
As always, the way we calculate each party's expected seat totals is by summing their probability of victory for each seat. This is explained in the introduction to our 2017 model. These values are called expected seat counts.
Doing this, our model gives the following expected seat counts for each party:
Party |
Current seats |
Expected seats |
Conservatives |
288 |
343.0 |
Labour |
248 |
202.8 |
SNP |
35 |
44.4 |
Liberal Democrats |
17 |
33.2 |
DUP |
10 |
8.6 |
Sinn Féin |
7 |
6.4 |
Plaid Cymru |
4 |
4.1 |
SDLP |
O |
1.9 |
Green Party |
1 |
1.4 |
Brexit Party |
O |
1.0 |
Alliance |
O |
0.6 |
Ulster Unionists |
O |
0.5 |
Change UK |
5 |
0.2 |
Independents & other parties |
35 |
2.0 |
The threshold for a majority is 325, although as Sinn Féin don't take up their seats in the commons, it is in practice lower than that. Either way, if the result of the December 12th poll did end up as above, it would be a comfortable majority for the Conservatives.
With the SNP and the Liberal Democrats also seeing healthy seat increases, this would be a disastrous result for Labour, with their only gains coming from regaining seats they originally held, but had become Independent/Change UK in the course of the last parliament.
One shred of comfort for Labour is that we had the Conservatives on 395.3 seats at this stage in the 2017 election, and Labour were able to go from there to denying them a majority.
Result ranges
Of course, a single seat prediction isn't going to be accurate, and furthermore it doesn't really give you a sense of what might be possible. Therefore, we can calculate a range of plausible results.
To do this, we run the model 10,000 times, picking results randomly for each seat based on their probabilities. These are the results:
Below is the information in the graphs above given in table form. For each party is the range (the minimum and maximum seat count in the simulations above), their 95% confidence interval (where the central 95% of result lie) and their 50% confidence interval:
Party |
Range |
95% CI |
50% CI |
Conservatives |
236-439 |
268-408 |
315-368 |
Labour |
122-302 |
145-266 |
181-225 |
SNP |
21-59 |
30-53 |
39-48 |
Liberal Democrats |
5-83 |
14-64 |
25-44 |
DUP |
3-12 |
6-10 |
8-9 |
Sinn Féin |
3-9 |
4-7 |
6-7 |
Plaid Cymru |
0-10 |
2-7 |
3-5 |
SDLP |
0-4 |
0-3 |
1-2 |
Green Party |
0-7 |
1-4 |
1-2 |
Brexit Party |
0-12 |
0-6 |
0-2 |
Alliance |
0-5 |
0-3 |
0-1 |
Ulster Unionists |
0-4 |
0-2 |
0-1 |
Change UK |
0-2 |
0-1 |
0-0 |
Independents & other parties |
0-6 |
1-4 |
1-3 |
Of course, arguably the key question from any General Election is who can form a majority. We can look at the following five scenarios:
(I am using Leave-ish and Remain-ish as a broad tag, of course there are fairly key differences between parties grouped together here).
Below is the frequency of times each of those scenarios played out:
- Conservatives have a majority
- Conservative can't form a majority, but they can with help from fellow Leave-ish parties (DUP, Brexit Party, Ulster Unionists).
- Neither the Leave-ish parties nor the Remain-ish parties can form a majority (we are counting Independents and Sinn Féin as neither)
- Labour can't form a majority, but they can with help from fellow Remain-ish parties (all others yet mentioned)
- Labour have a majority
(I am using Leave-ish and Remain-ish as a broad tag, of course there are fairly key differences between parties grouped together here).
Below is the frequency of times each of those scenarios played out:
Outcome |
Frequency |
Conservative majority |
69.3% |
Leave-ish majority |
8.6% |
No Leave-ish or Remain-ish majority |
1.5% |
Remain-ish majority |
20.7% |
Labour majority |
0.0% |
Of course, in scenario 3 the identity of the independents will determine whether a majority can be formed.
As everyone has known all along, it looks as if the only way there isn't a Leave-ish government is if the Remain-ish parties work together. Currently that looks unlikely, but parties are always more conciliatory after an election than before.
The odds are clearly in favour of a Conservative government, although they are less strong than they were towards them in the 2017 campaign. However, it would be foolish to assume that everyone would automatically make the same mistake two elections in a row.
Conclusion
Our first article on this election saw us make nationwide predictions based on limited data. There, we suggested the expected seat count would be 339.4 for the Conservatives and 205.5 for Labour. Once we had all the data, we ended up with 343.0 and 202.8 respectively. These are pretty close! So I can think we can probably say that was a job well done earlier.
Soon, we will put an interactive version of the model on our General Election 2019 page, where you can run your own simulations. You will be able to apply factors to strengthen each party, if you think the initial values are too generous/harsh in some direction. Later, you will also be able to explore individual constituencies and parties.
With about three weeks before the vote, we will continue to publish articles exploring different aspects of the election. If there is anything you would like to be covered, please put a suggestion in the comments!
 RSS Feed