by Adrian Worton
If you didn't know, there was an election last Thursday. For all the details of the result, please see our Election Live page, which is where we displayed the results as they came in.
Today we will be briefly going through the results in order to see how our predictions and method held up.
If you didn't know, there was an election last Thursday. For all the details of the result, please see our Election Live page, which is where we displayed the results as they came in.
Today we will be briefly going through the results in order to see how our predictions and method held up.
In order to view the result for South Shields, please scroll down to the Appendix at the end of the article.
Seat total predictions
On the very morning of the vote, we updated the odds within our model and ran 2000 simulations in order to get an idea of the range we would expect each party to fall into.
Below we have plotted the range of our predictions compared to the real results. The bars represent the absolute range of our results, with the centre area being the peak range for our predictions. The star for each party represents the actual value:
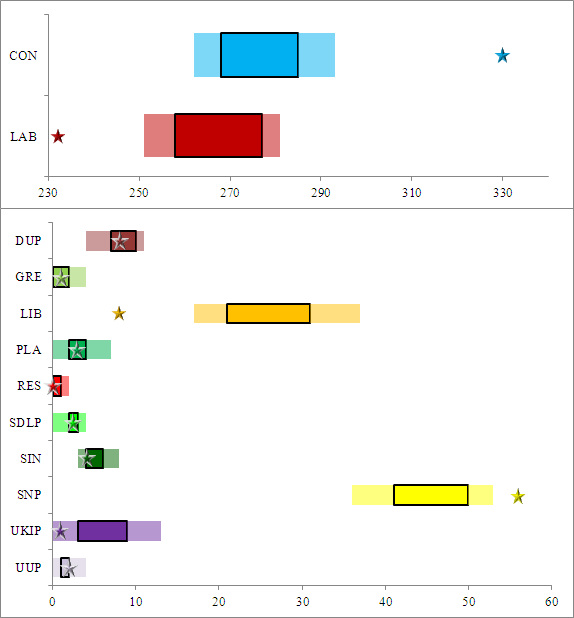
Firstly, the good news is that for all the parties where we expected them to score under 10, we got our range spot-on, with all of these except UKIP landing in the 'peak' range.
However, for the other four parties, our predictions were not within the range. The number of seats that the parties finished with, compared to our ranges, are as follows:
For the SNP, we did anticipate beforehand how our model might have underestimated their chances, so to be out by 3 is perhaps understandable. However, for the other three parties the distance with which we missed is colossal and requires investigating. We will discuss these errors later in the article.
Transformations of odds
In April we uncovered odds set ahead of the 2010 election, and used these to adjust our model in order to tweak our methodology to boost the chances of favourites in seats. We used a parameter called ϕ, which brought about the required effect. The higher ϕ is, the more it increases the chance of each seat's favourite winning. A value of 1 represents no change - we just take our probabilities to be those directly suggested by the odds.
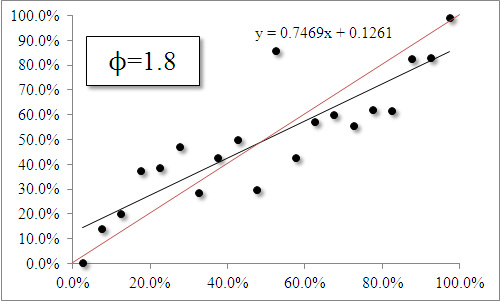
Using a relatively subjective method, we decided that a value of 1.8 was the most appropriate. We can now break up our resulting probabilities into bands of 5%, we can see what proportion of those came through. So, for instance, we look at all the candidates who had a chance of between 0-5% and see how many of those won, etc.
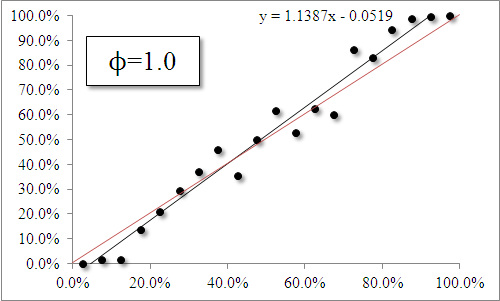
By doing this for various values of ϕ, we can see whether we chose the appropriate transformation. Firstly, we compare the value of 1.8 we used to the 1.0 that we had initially been using:
However, for the other four parties, our predictions were not within the range. The number of seats that the parties finished with, compared to our ranges, are as follows:
- Conservatives - 37 above
- Labour - 19 below
- Liberal Democrats - 9 below
- SNP - 3 above
For the SNP, we did anticipate beforehand how our model might have underestimated their chances, so to be out by 3 is perhaps understandable. However, for the other three parties the distance with which we missed is colossal and requires investigating. We will discuss these errors later in the article.
Transformations of odds
In April we uncovered odds set ahead of the 2010 election, and used these to adjust our model in order to tweak our methodology to boost the chances of favourites in seats. We used a parameter called ϕ, which brought about the required effect. The higher ϕ is, the more it increases the chance of each seat's favourite winning. A value of 1 represents no change - we just take our probabilities to be those directly suggested by the odds.
Using a relatively subjective method, we decided that a value of 1.8 was the most appropriate. We can now break up our resulting probabilities into bands of 5%, we can see what proportion of those came through. So, for instance, we look at all the candidates who had a chance of between 0-5% and see how many of those won, etc.
By doing this for various values of ϕ, we can see whether we chose the appropriate transformation. Firstly, we compare the value of 1.8 we used to the 1.0 that we had initially been using:
 |  |
| Previous article: General Election Simulator - Final Update |
The black line represents the line of best fit, and the closer it is to the red line (a diagonal line running from (0%, 0%) to (100%, 100%) then the better the estimation is. The formula on each graph is the regression equation, and the closer the value in front of the x is (e.g. 0.7469 on the left), the better the estimation.
We can see that using ϕ=1.0 gives us closer results. In other words, our transformation actually reduced the quality of our estimation of how odds should be transformed into probabilities.
The next step is to find the value of ϕ which would have done this job the best. Below are the graphs for increasing ϕ by increments of 0.1 between our two examples above. Use either the arrow keys or the thumbnails to navigate between the different graphs.
We see that the closest approximation comes when ϕ is equal to 1.2. But would having the correct value actually improve the quality of our predictions? Below we look at the expected number of seats for varying values of ϕ - looking at values between 1 and 2, as well as infinity, which is where the favourite for a seat will always win (in the case of joint-favourites, shared equally):
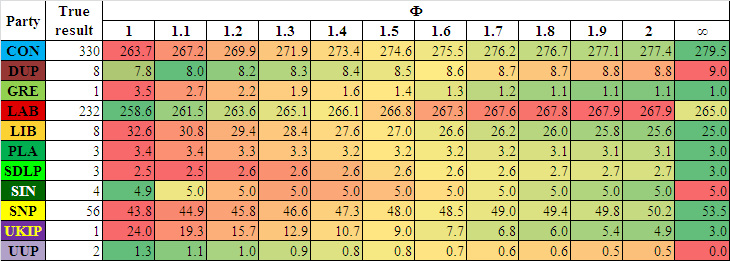
For each row, the green values are the closest to the true result, the red further away.
We see that in most cases, the higher ϕ is, the better our estimation is. In all cases, higher values of ϕ led us closer to values which were more in line with those which were predicted elsewhere (which we looked at here).
So whilst a lower ϕ would have allowed us to get us the best transformation of odds into probabilities, in fact it would have made our predictions even wilder. In particular, we would have been estimating the total UKIP seats as around 16. Therefore, in order to find the value of ϕ which best suits all our needs, it needs to balance the spread of probabilities with getting scale of results. This will be quite a complicated task, and will require a new article.
Conclusion
We have seen that our predictions were, in many cases, a long way away from our target. Crucially, this meant that are apparently-confident predictions for which bets are good value for money were based on weak foundations, and resulted in an average of 14p lost for every £1 placed. This is a very poor return, and suggests there are many aspects of our modelling approach which need investigation.
However, this needs to be placed into a wider context. The most obvious one is that no-one predicted the final party seat numbers with any degree of success. The final predictions made by a variety of sources show that no-one predicted the Conservative seats to within even 40, Labour within 25 or the Liberal Democrats to within 10. As it is opinion polls which feed into election forecasts, the real issue in the divergence between predictions and reality is comprehensively with them. And indeed, the British Polling Council will be conducting an inquiry into the errors made by pollsters.
We have long argued that the absolutist method used by pollsters, and others who have been predicting the election, is fundamentally flawed, and the results of the election show why. For example, the Guardian predicted both Labour and the Conservatives to finish on 273 seats. But this clearly isn't a nailed-on certainty. For example, if the Conservatives had finished on 274 seats, and Labour 272, they would have seen this as a triumph of their polling. But totals of 373 and 173 would clearly have been an abject defeat. So we need to know what range of results did they expect, not just their most likely outcome.
This is why we have uniquely favoured a probability-based approach. It means our model is far more robust than those used elsewhere, and it allows us to make ranges of predictions. For instance, within our model totals for the Conservatives and Labour of 290 and 255 would have been entirely plausible, both of which are closer to the real values than any other predictor.
This, therefore, is a vindication of the method we used to predict the election. But we could have done even better. If the model had been built differently we should have been able to give prediction ranges which included the final result. We will be looking in the upcoming days at how the model could have been built differently to this end.
It should be noted, as well, that this is a first attempt at an unorthodox method of prediction the election on very limited past data. With the lessons learned this week, there is a real chance that our method of interpreting the data and providing predictions for possible results will become a method which substantially outshines currently conventional methods.
Appendix - South Shields result
Labour hold
Labour hold
General Election articles
Previous: General Election Simulator - Final Update
Next: Phinding Phi
Previous: General Election Simulator - Final Update
Next: Phinding Phi
 RSS Feed