by Adrian Worton
As we enter May, the election is looming very large. And as there has been so much work done here on making predictions, the natural progression is to use our model to cover the election live.
As we enter May, the election is looming very large. And as there has been so much work done here on making predictions, the natural progression is to use our model to cover the election live.
The projected seats are calculated in the same way, except that it is altered by results coming in live. So in our previous example, if the party won the second seat, the probabilities would change to 35%, 100% and 15%, so the sum of these would be 1.5, suggesting that two seats appears to be just as likely as one seat.
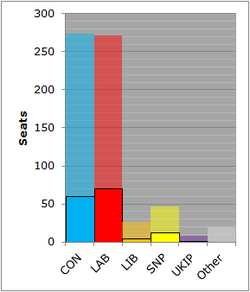
The bar chart shows the current seats (opaque) and the projected seats (translucent). In the example on the right, we can see that whilst Labour have a decent lead out of the declared seats, the projection shows that the Conservatives will end with slightly more seats.
The '%change' column simply shows the percentage change between the expected and projected seats - a measure of how parties are doing relative to our expectations at the start of the night.
Potential coalitions
As well as showing the expected and projected tallies for each party, we will be looking at potential coalitions, too. These are those we previously identified:
If any of these become projected to reach the magic 323 value which will be needed to command a majority, their score will be highlighted in green.
Most seats likelihood
The bar chart shows the current seats (opaque) and the projected seats (translucent). In the example on the right, we can see that whilst Labour have a decent lead out of the declared seats, the projection shows that the Conservatives will end with slightly more seats.
The '%change' column simply shows the percentage change between the expected and projected seats - a measure of how parties are doing relative to our expectations at the start of the night.
Potential coalitions
As well as showing the expected and projected tallies for each party, we will be looking at potential coalitions, too. These are those we previously identified:
- Conservatives/DUP/UKIP
- Conservatives/Liberal Democrats
- Labour/Greens/Plaid/SNP
- Labour/Liberal Democrats
- Labour/SNP
If any of these become projected to reach the magic 323 value which will be needed to command a majority, their score will be highlighted in green.
Most seats likelihood
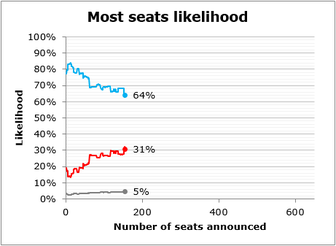
Possibly the most exciting feature of our live election coverage is the most seats likelihood - the chance that the Conservatives or Labour will finish the night with the most seats.
Because our model is built around individual probabilities for each seat, we are uniquely placed to be able to get an estimation of these probabilities. As well as stating the current position of our three outcomes, our worm graph (an example of which is above) tracks the three probabilities during the night. In this example, we see that the Conservatives are favourite to finish with the most seats, but this chance has gone down from 78% to 64% after around 150 seats have been declared.
Return from recommended bets
A couple of weeks ago we used the tweaking of our model to find a series of bets which appear to be very good value for money, so much so that a profit is very likely. Therefore we could make a series of recommended bets, which we have backed up with £2 placed on each bet (£100 overall). So during the night we will be tracking the profit or loss made by our bets.
So when a bet is lost, the £2 stake placed is taken away, but if a bet is successful then the return is added (minus the stake placed).
Results map
By clicking Election Live at the top of this page, you will be taken to the page where we will be giving you all the latest stats on the election as it happens. Up until the day before the election we will be using random simulations from our General Election model to demonstrate how the page will look.
As there is a huge amount of different facts and figures on our Election Live page, we will walk you through them here, rather than cluttering the page up with various explanations.
#TGIAFLive
At the top of the Election Live page is a live Twitter feed, where any tweets using the hashtag #TGIAFLive will appear. Here there will be the latest updates from the election, including our predictions, from @RedOwl14 (my personal account), and if you are on Twitter please feel free to, as Dimbleby says, join the conversation.
Air3 Radio
As well as maintaining the Election Live coverage on this website, I will also be providing analysis on the Air3 (the student radio station of the University of Stirling) coverage throughout the night, including the predictions from our model, and analysis of key seats.
Anyone can listen in - simply visit the website and click on 'Xtra' on the navigation menu.
(Update: due to scheduling difficulties, the Air3 election coverage has been cancelled)
Expected/projected seats
The expected seats for each party score given is calculated by summing their probabilities of winning across all seats. So for example, if a party was only contesting three seats, and its chances of winning were 35%, 60% and 15%, then their expected seat score is 0.35 + 0.6 + 0.15 = 1.1. So overall, the party would be expected to win 1 seat, but with a higher chance of getting more than less.
This value will be calculated on the night before the vote (i.e. before 7am on the 7th of May), using the latest bookmakers' odds.
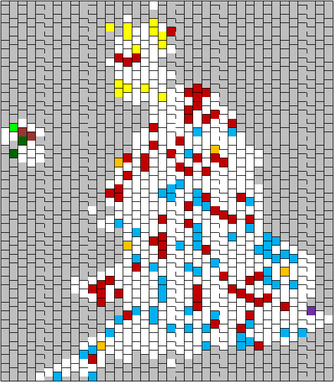
We will be also providing a map showing the declared seats so far. This map is proportional, therefore each constituency is represented by a single square, hence why the country looks somewhat deformed. The map is based on a similar one the BBC used for their coverage of the 2010 election.
Until a seat is declared, it will appear in white. Once there is a winner, their colour will appear on the map.
Until a seat is declared, it will appear in white. Once there is a winner, their colour will appear on the map.
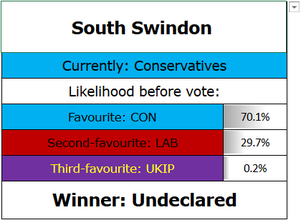
Individual constituencies
At the bottom of the page you can select an individual seat you want to view the status of. Here you'll see the incumbent, the probabilities before the day of the vote, and (if the seat has been declared) the winner.
On the right you can see an example with the key marginal seat of South Swindon.
At the bottom of the page you can select an individual seat you want to view the status of. Here you'll see the incumbent, the probabilities before the day of the vote, and (if the seat has been declared) the winner.
On the right you can see an example with the key marginal seat of South Swindon.
Summary
Due to the unique nature of our model, we are able to utilise the probabilities built into it in a way no-one else can.
Whilst the traditional media will just be showing the more conventional stats (seats won, gained, lost), as well as the bizarre swingometer, we are able to offer alternatives due to our model being able to anticipate the upcoming seats.
In other words, come the night of the election, the best coverage you will get of the election will be right here on TGIAF!
General Election articles
Previous: General Election Simulator - 9 days to go
Next: General Election Simulator - May Update
Previous: General Election Simulator - 9 days to go
Next: General Election Simulator - May Update
 RSS Feed