by Dr Adrian Worton
The dust has settled on another election with a surprise result. In this article we are going to review how our General Election model performed, starting with our party-by-party predictions. We will be looking at other aspects of our model output in future articles.
The dust has settled on another election with a surprise result. In this article we are going to review how our General Election model performed, starting with our party-by-party predictions. We will be looking at other aspects of our model output in future articles.
We're going to throw in our excuse early on - our model is purely based on an interpretation of bookmakers' odds, and so our predictions are entirely based on how they see it.
Party-by-party predictions
Conservatives (likely range: 353-396; actual count: 318)
Clearly, our predictions for the Conservatives' seat tally were significantly off, with our final expected count of 375 too high by a whopping 57. More importantly, we estimated the likely range of seat counts they could end up with, and our lower bound was still far too high at 353.
This said, that likely range only takes the middle 50% (also known as the inter-quartile range) of predictions. If we look at the full range of results we find the lowest Conservative seat count was 306, 12 below their actual tally. This means that at least our model did have some way of predicting their true outcome.
Below we can see a timeline of our predicted Conservative seat count in the month before the election:
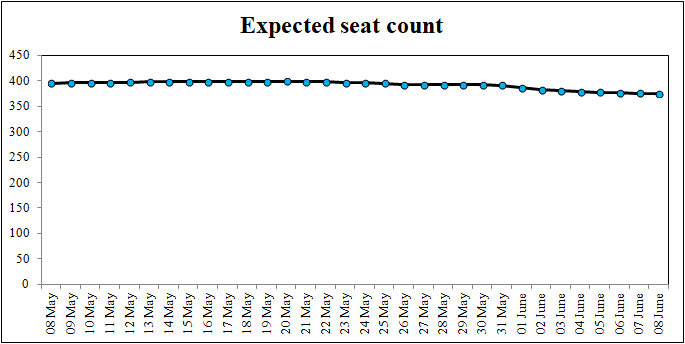
In our election day update, we noted that in 2015 the bookmakers seemed slow to react to new polling. In other words, the parties that they had slowly been shortening the odds of ended up doing far better than expected, and those that they had been extending the odds of ended up doing even worse than expected. And this trend is continued here, since our timeline shows that the bookmakers' faith in the Conservatives dwindled as the month progressed (in line with new polls), but never enough so that 318 was ever a likely outcome.
Labour (likely range: 174-210; actual count: 262)
Once again, we were not close at all with our prediction of Labour's seat count. In fact, we were even further off than with the Conservatives, with our final expected seat count (192) 70 away from the final result.
Additionally, when we did our simulations of the model to give a predicted range of seat counts, the highest Labour managed was 252, still 10 short. This gives an idea to the scale to which the bookmakers underestimated Labour.
Below is our timeline of Labour's progress during the month:
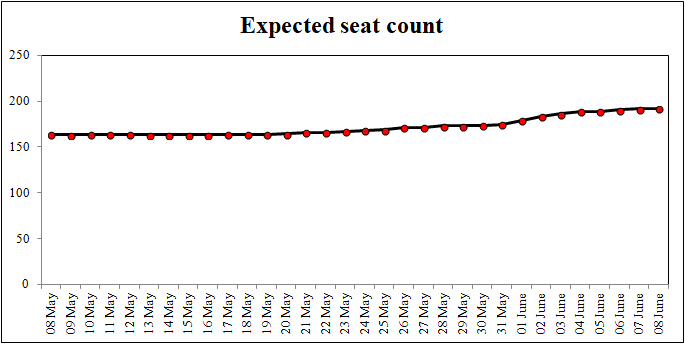
For a while they were stagnant, but they started to rise fairly sharply once YouGov started publishing the results of their unusual new model, all of which predicted Labour denying a Conservative majority.
Labour's growth slowed in the final week of campaigning, and at no point did it look like they were rising quickly enough to reach 262. So once again, this fits in with the trend of the bookmakers being slow to catch up with different polling.
SNP (likely range: 43-49; actual count: 35)
Similar to the Conservatives, our model had the SNP performing much higher than they achieved, although this time our prediction of 46 was only 11 higher than the final count.
As with the Conservatives, the SNP' full range of simulated results did include their actual final count, as the lowest we saw was 30.
There isn't much point in showing their timeline (you can view it on our General Election page anyway), as at no point do they have an expected seat count above 47, nor do they ever dip below 46. This means that there was no real dip in their expected seat count which could have predicted that they finished well below their expected range.
Other parties
We will look at all the other parties together. The table below shows our prediction, their final count and whether our prediction was accurate.
Party |
Expected seat count |
Likely range |
Actual count |
Accurate? |
Liberal Democrat |
13 |
10-20 |
12 |
Yes |
Democratic Unionist |
8 |
7-9 |
10 |
No |
Sinn Féin |
6 |
5-7 |
7 |
Yes |
Plaid Cymru |
4 |
3-5 |
4 |
Yes |
SDLP |
2 |
1-2 |
O |
No |
Ulster Unionist |
1 |
0-1 |
O |
Yes |
Green |
1 |
1-1 |
1 |
Yes |
UKIP |
O |
0-1 |
O |
Yes |
Independents & other parties |
2 |
1-2 |
1 |
Yes |
Surprisingly, given our performance with the big parties, our predictions for the smaller parties were very accurate - our only two results out of our predicted range were only out by 1 seat (and were included in our full ranges).
An interesting side note is that many other places where they tried to predict the election results neglected Northern Irish parties (grouping them together, generally). However, we have consistently included the Northern Irish parties in our analysis, and post-election events have vindicated us on that, as a huge spotlight has been turned onto the DUP in particular. In our study of how a Progressive Alliance could work, we included the DUP and UUP as parties who would likely support the Conservatives, and so it has proved.
Summary
It is monumentally hard to predict elections, particularly with new volatile factors coming into play, such as the Brexit vote changing traditional voter patterns (such as northern towns moving towards the Conservatives, but well-off southern areas moving towards Labour) and an increasing youth vote.
Therefore, it should not be considered a surprise that for the second election in a row, the bookmakers (and therefore our model) misjudged where the likely centre of balance between the big two parties would be. However, unlike 2015 the predictions made elsewhere (notably by YouGov - much derided two years ago) included ones predicting the actual final results, so it is surprising that the bookmakers odds pointed to a result significantly out of the consensus elsewhere.
It is interesting to note that for the Conservatives and Labour, we found that the bookmakers had each party's trajectory correct (i.e. over time they moved from the former to the latter), but by nowhere enough. This is the same as we observed in 2015, and a possibly modification to the model we use is to exaggerate any change made in a party's expected seat count to account for the slowness of bookmakers.
We will continue our review of the election next time by looking at how well we described probabilities for individual seats.
 RSS Feed