by Dr Adrian Worton
We are conducting the autopsy of our General Election 2017 model. Last time we looked at our individual predictions for each party. The issue with those is that we have little say over the location of these predictions. For example, if the bookies believe a party will make X seats, then our model will to, even if polling says they will make significantly fewer or more.
This time, we are looking at an element of our model that is definitely in our court - the chances of parties winning individual seats. Specifically, we will be looking at how we convert bookies' odds into probabilities.
Our method
In most of our other odds-related models, we simply invert our odds, then adjust so they add up to a combined probability of 100%. However, in the build-up to the 2015 election we found that this method led to smaller parties being predicted to take significantly more seats than anyone realistically thought. To combat this, we applied a parameter Φ (phi) which strengthened the chances of the seat favourite winning. How this is applied is explained here. We used a value of 1.8 for Φ in 2015, which we kept for this election.
This has quite a dramatic effect - for example, predicted to have an 85% chance of winning with no Φ will move up to around 97% when Φ is applied., meaning they are about five times less likely to lose.
We will now look to see whether Φ is skewing our results too far in the other direction.
Individual seat probabilities
The best way to see how effectively our model predicted the individual chances of a party winning a seat is to compare them to the results of the election. We look at our predicted probabilities for first-, second- and third-favourites for each seat (making 1950 party-seat combinations).
We then group each party-seat probability into 5% bands, with separate groups for the absolutes of 100% and 0%. So for example, DUP in Belfast South was given an 81% chance of winning, so they go into the 80-85% band.
We then simply count how many party-seat combinations in each band actually resulted in a win. This should be roughly equal to the percentages each band represents. For example, we would expect roughly 12.5% of those in the 10-15% band to win.
Plotting the results, we get the following graph, where the black line represents our bands, and the red line represents the line we are aiming for:
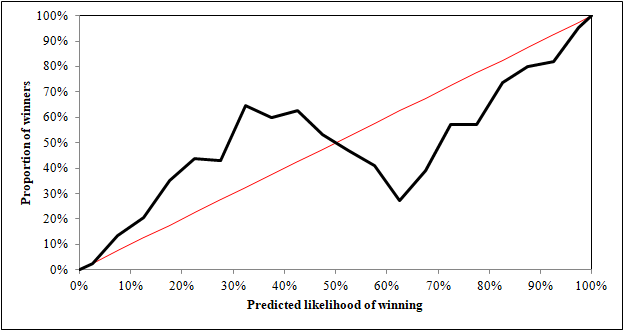
Well, we can see that there is a rough upward progression, exactly as we would expect. However, the most striking thing is the 'lightning bolt'-like trend. This appears to be caused by party-seat probabilities that are marginal second-favourites (roughly between 30-45%) performing better than we expected, whilst those who are marginal favourites (roughly between 55-70%) a long way below the rate expected.
What we can draw from this is that in quite a few marginal seats, the bookmakers called the wrong party to be favourite. There's not much we can do about this, but the fact that all bands above 50% are below the red line and all bands below 50% are above the line suggests that we have generally overestimated seat favourites, indicating that our value of Φ is too high.
We can alter Φ to change our party-seat probabilities, and see how this affects the graph. Looking at values of Φ between 1.0 and 1.8, the resulting graphs can be seen in the slideshow below. Use the arrow icons to switch between graphs.
Of course, for each graph we will see a bit of a lightning bolt effect, as seat favourites will remain seat favourites regardless of the value of Φ.
With this in mind, the two values of Φ that are the closest to the red line are 1.1 and 1.2 - both significantly lower than the 1.8 we have been using. As a value of Φ of 1.0 is the same as not having Φ at all, and it suggests that our Φ value of 1.8 has actually made our results less accurate than not having the parameter at all.
We will not judge on which value is best just yet, as first we have a second way of measuring the predictions made by our Φ values.
Overall results
The reason we introduced Φ in 2015 was that our model was giving predicted seat counts for smaller parties far higher than we'd otherwise expect. In particular, our expected seat counts for UKIP were around 30, compared to the predictions under 5 that were being made elsewhere.
If we adjust our Φ value we can see what our model would have predicted for each party's final expected seat count. These predictions are shown in the table below, with the closest to the actual result in green, the furthest in red.
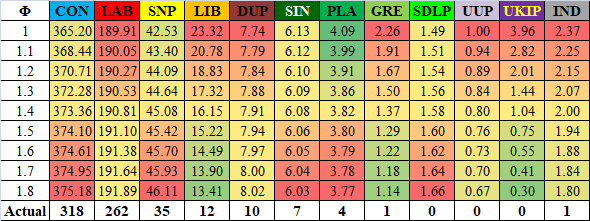
Now we can see the difficulties with low values of Φ - if we had reduced it to 1.0 we might have been around 10 seats closer to the correct Conservative tally, but we would have been further away from the correct Labour tally, as well as providing significantly different values for the Liberal Democrats and UKIP.
In fact, the average error for each party with a value of Φ = 1.8 is 12.21, whilst for Φ = 1.0 it is 12.54 (with average errors following a generally linear pattern between the two Φ values).
Summary
By looking at a key parameter of our model, we find that it wildly changes the nature of its predictions.
This parameter, Φ, boosts the chance of the favourite winning a given seat. However, by looking at the results as a whole, we find that it has done this too zealously. In fact, a Φ value of around 1.1-1.2 would have given better predictions. There was a kink in the results that was out of our control, namely that the bookmakers appeared to do a poor job of picking the favourite in marginal constituencies.
We also looked at how different values of Φ affect the model's total seat predictions for each party. Here the effect was less clear, as some parties became more accurately-predicted, and some had the opposite effect.
However, as a lower Φ value will also increase the likely range of seats for each party, the centre of each distribution potentially moving away from the correct result is not as big an issue. Therefore, it appears that a lower Φ value will significantly improve our predictions.
Therefore, we will work with a Φ of 1.1 if there is (as some have predicted) another election by the end of the year.
 RSS Feed