by Dr Adrian Worton
We are just three days away from the 2017 General Election (I know, it feels like the campaign has been going on forever), and some of you will be planning to stay up all night and follow the results as they come in.
Well, we are going to be covering the election live, as we did in 2015, on TGIAF! We will be using our 2017 General Election model to give predictions and to signify where the interesting results lie.
We will be covering it on this dedicated page, and this article will run through the different elements we are going to cover on that page. Please note that any screenshots will be examples made from a random generation of results.
Election dossier
Using the final edition of our Election model we will be providing a guide to all 650 constituencies - containing the likelihoods of each party winning, which seats are likely to be the closest, and notable candidates. This will be provided in an article on election day, but you can also download it from our Election Live page.
Twitter feed
On the Election Live page is a tab where you can view the latest tweets from our (all-new!) Twitter page. Feel free to send us tweets, and we'll try and reply, even during the mega-busy period from about 3pm onwards!
Results overview
This tab contains all the main information our coverage is providing. So we'll run through the bits of it one-at-a-time:
Results table
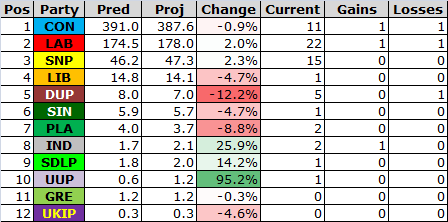
This table contains all the information you would expect elsewhere - specifically, the current seat count, as well as gains and losses. Note that any parties not listed are included under "IND".
However, we also use our model to do a few things:
- The 'Pred' column gives our pre-vote prediction of the final seat count.
- The 'Proj' column is our projection of how the results will go from the current state (this also dictates the order that the parties are listed).
- The 'Change' column is a measure of how well each party is doing compared to the pre-vote predictions.
You will see that Labour are in the lead in the example above - early on in the night you will likely see this happening, simply because Labour-held seats (for whatever reason) are often the earliest to call their results.
Recently announced results
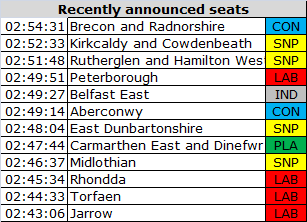
This is exactly what you would expect - a list of the most recent seats to be announced, and how they went.
The time given is when we entered the result into the model, rather than the time it was called.
As we collected this data in 2015, this has allowed us to give an estimate of when the seat should be called in our Dossier.
Biggest shocks
The time given is when we entered the result into the model, rather than the time it was called.
As we collected this data in 2015, this has allowed us to give an estimate of when the seat should be called in our Dossier.
Biggest shocks
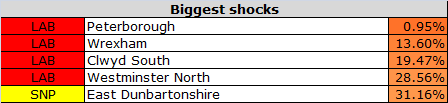
Since our model gives the probability of each party winning each seat, we can measure which results have been the most surprising thus far. These will be ranked here.
Note that the example above is Labour-heavy as the probabilities and results were taken from different editions of the model - on election night the latest probabilities will be used.
Expected next announcements
Note that the example above is Labour-heavy as the probabilities and results were taken from different editions of the model - on election night the latest probabilities will be used.
Expected next announcements
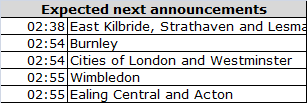
As mentioned above, we recorded when the 2015 results were logged. Therefore, we can estimate which seats will be next to announce their results.
Projected seat count
Projected seat count
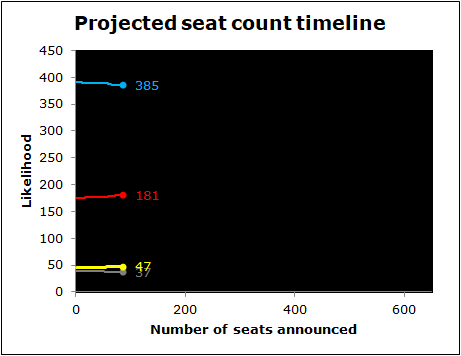
As the night progresses, we will be tracking the expected seat count for the three largest parties (example above), with grey representing the other parties combined. This means we'll be able to identify where any major shifts have occurred.
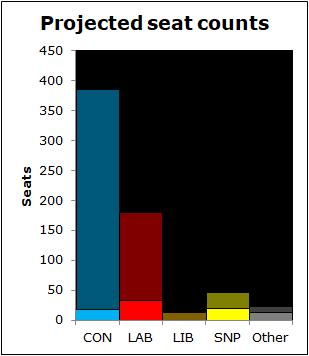
Additionally, the graph to the left shows the projected seat counts (translucent), and how much of that each party has actually got so far (solid).
Additionally, the graph to the left shows the projected seat counts (translucent), and how much of that each party has actually got so far (solid).
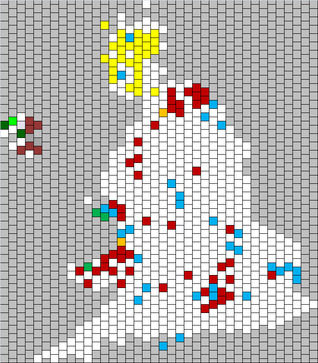
Results map
Like the BBC and others, we have a map displaying the results as they come in, scaled to be proportional so that each constituency is equally-sized. Seats are only coloured in when results are called.
Like the BBC and others, we have a map displaying the results as they come in, scaled to be proportional so that each constituency is equally-sized. Seats are only coloured in when results are called.
Individual constituencies
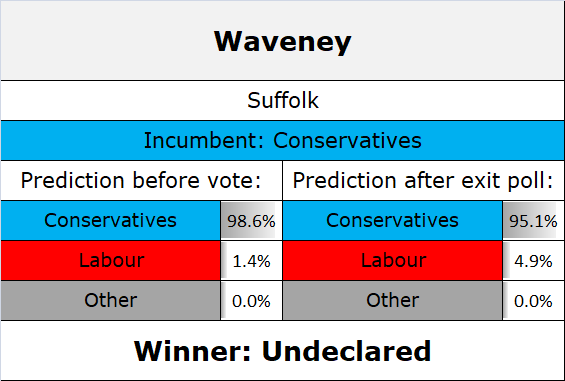
You will, of course, be interested in your local seat. Well, we have the option to look at the details for a particular seat. By selecting your seat from the drop-down list you can find our prediction, made before voting, as well as a modified prediction to take the exit poll into account. If the seat has been called, the result will also be shown.
An example below shows Waveney in Suffolk for a hypothetical exit poll.
That's it for the information you will find on our Election Live coverage, however there is one more thing...
Dummy Election
On the day before the vote (Wednesday the 7th of May), we will be testing the Election Live page by running a dummy election with randomly-generated results.
This will happen from 3pm, so if you are curious to see (a) how the page looks once results are underway, and (b) what happens in our generation, feel free to watch along!
 RSS Feed