by Dr Adrian Worton
Is it really the end of this snap General Election? Yes, we are finally there. And in this post we are going to simulate our General Election model one last time to give our final predictions.
We will give party-by-party estimates, individual predictions for each part of the UK, and we will see how our comparisons measure up to elsewhere.
At the bottom of this page you can download the official TGIAF Election Dossier, a document which contains our predictions - for the election as a whole, as well as for every constituency. And don't forget, tonight we will be covering the election live here with our innovative analysis.
Expected seat counts
We use the expected seat counts (which we explained here) to measure the progress of each party. These have been tracked on our special Election page, and below is a summary of how each party has changed whilst we have been recording the data:
We use the expected seat counts (which we explained here) to measure the progress of each party. These have been tracked on our special Election page, and below is a summary of how each party has changed whilst we have been recording the data:
Party |
Current Seats |
Exp (04/05/17) |
Exp (08/06/17) |
% Change |
Conservative |
330 |
395.33 |
375.18 |
-5.1% |
Labour |
230 |
163.54 |
191.89 |
+17.3% |
SNP |
54 |
46.68 |
46.11 |
-1.2% |
Liberal Democrat |
9 |
20.26 |
13.41 |
-33.8% |
Democratic Unionist |
8 |
8.13 |
8.02 |
-1.3% |
Sinn Féin |
4 |
5.73 |
6.03 |
+5.2% |
Plaid Cymru |
3 |
3.91 |
3.77 |
-3.5% |
SDLP |
3 |
1.64 |
1.66 |
+1.3% |
Ulster Unionist |
2 |
1.00 |
0.67 |
-33.0% |
Green |
1 |
1.48 |
1.14 |
-22.9% |
UKIP |
O |
0.81 |
0.30 |
-62.6% |
Independents & other parties |
6 |
1.51 |
1.80 |
+19.5% |
We can see that, Northern Ireland apart, every party has lost expected seats to Labour. This has been driven by the recent narrowing of the polls. However, the news still isn't pretty for Labour, they still appear to be in a battle to finish with at least 200 seats.
Seat range estimates
The expected value tells us where the parties are relative to each other, but we also want to know what range their results might lie within.
Is it too complicated to find the true probabilities for each party's expected seat counts thanks to our random swing parameters - so we have simulated the model 5000 times, recording the results. We will go through each of the parties to see how many seats they ended up with:
Conservatives
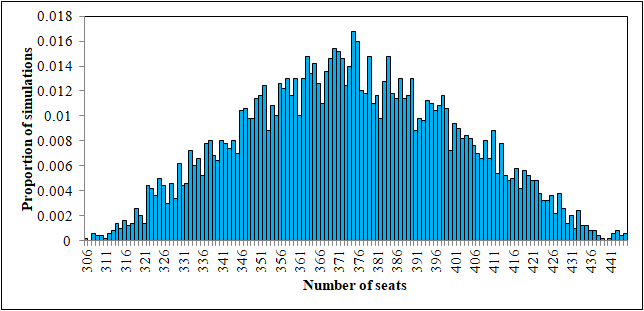
As we would expect, given the table above, this peaks somewhere in the 370s. In our first update we found the Conservatives increased their majority in 99% of cases, and this has only marginally decreased to 94.5%. In 3.7% of cases they failed to achieve an overall majority.
As for their best-case scenarios, they have a 19.0% chance of recording over 400 seats (down noticeably from 41.6%), and a 5.7% chance of setting a new record for seats held by a particular party (down from 18.4%).
Labour
As for their best-case scenarios, they have a 19.0% chance of recording over 400 seats (down noticeably from 41.6%), and a 5.7% chance of setting a new record for seats held by a particular party (down from 18.4%).
Labour
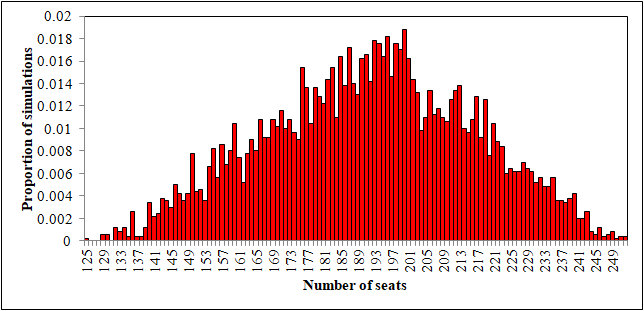
Labour still appear likely to record under 200 seats, which happened in 61.8% of our simulations. This is an improvement from the 92.2% we found in May.
There is now a small chance (5.7%) that Labour could end with a net gain of seats, up to a highest value of 252, a gain of 22.
The SNP
There is now a small chance (5.7%) that Labour could end with a net gain of seats, up to a highest value of 252, a gain of 22.
The SNP
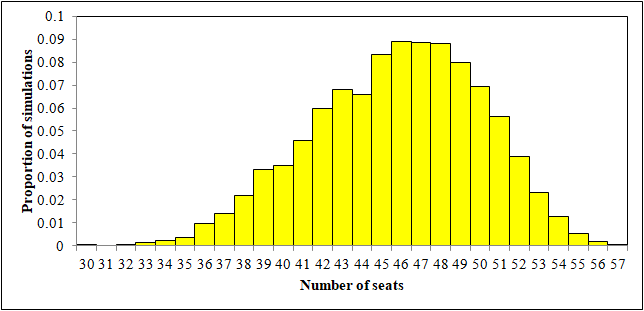
If you look at the SNP's party profile on our Election page, you will see how utterly static their expected performance has been. And we see little difference here to the histogram we presented last time.
In May we said that the SNP recording a tally in the 40s was 66.8% likely, and this is similar, at 70.3%. Their chances of increasing their count is at 0.8%, slightly down from 1.7%.
Liberal Democrats
In May we said that the SNP recording a tally in the 40s was 66.8% likely, and this is similar, at 70.3%. Their chances of increasing their count is at 0.8%, slightly down from 1.7%.
Liberal Democrats
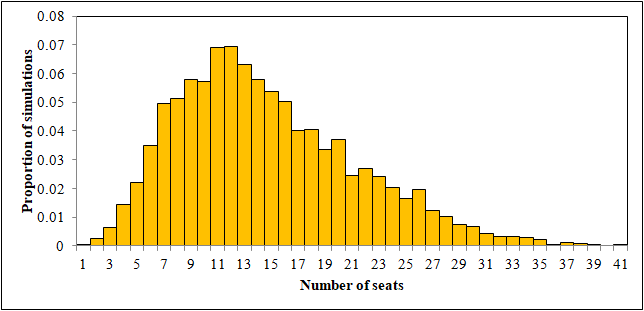
When the election was called, many people thought that the Lib Dems' stance as the country's pro-European party may benefit them in the same way the SNP were boosted by the Scottish Referendum vote. However, as the campaign has progressed, this appears to have been optimistic.
Previously, they appeared almost-certain to increase their seat count, but this eventuality has gone down to 76.0% from a high of 94.6%. Previously, their best-case scenarios saw them in the high 40s, but this is now around 10 seats lower as the best they can hope for is somewhere in the 30s.
Other parties
For each of the other parties, in order to avoid this article becoming too long, I am grouping them into the following table. Given are their lower quartile, median and upper quartile scores.
Party |
Q1 |
Q2 |
Q3 |
Democratic Unionist |
7 |
8 |
9 |
Sinn Féin |
5 |
6 |
7 |
Plaid Cymru |
3 |
4 |
5 |
SDLP |
1 |
2 |
2 |
Ulster Unionist |
O |
1 |
1 |
Green |
1 |
1 |
1 |
UKIP |
O |
O |
1 |
Independents & other parties |
1 |
2 |
2 |
You can take Q1 to roughly represent a party's worst-case scenario, Q3 to represent a best-case scenario, and Q2 to represent the most likely scenario.
Regional predictions
We will also look at what we expect to happen within each nation in the UK. Again, we are going to use quartiles and medians.
England
Regional predictions
We will also look at what we expect to happen within each nation in the UK. Again, we are going to use quartiles and medians.
England
Party |
Q1 |
Q2 |
Q3 |
Conservative |
336 |
352 |
369 |
Labour |
155 |
170 |
184 |
Liberal Democrat |
6 |
9 |
13 |
Green |
1 |
1 |
1 |
UKIP |
O |
O |
1 |
It appears likely that, regardless of the results elsewhere, the Conservatives will gain enough seats for a majority from England alone.
Northern Ireland
Due to Northern Ireland's unique political landscape, their parties are obviously the same as in the UK-wide table above, as they don't stand anywhere else. The Independents group should be essentially counted as a Northern Irish party, as it comprises Alliance and Lady Hermon (who stands in North Down).
Scotland
Party |
Q1 |
Q2 |
Q3 |
SNP |
43 |
46 |
49 |
Conservative |
5 |
7 |
10 |
Liberal Democrat |
3 |
4 |
5 |
Labour |
1 |
1 |
2 |
The shocking news for Labour is that they appear set to become Scotland's fourth party, a fall even from last year's Scottish elections. The Lib Dems may see Scotland as an area of unusual success for them, whilst the Conservatives could even get into double figures. The SNP, as discussed above, will expect a total in the 40s.
Wales
Wales
Party |
Q1 |
Q2 |
Q3 |
Labour |
18 |
21 |
24 |
Conservative |
12 |
14 |
17 |
Plaid Cymru |
3 |
4 |
5 |
Liberal Democrat |
1 |
1 |
2 |
Early rumours of a "Blue Dragon" result appear unlikely now, with the Conservative Q3 below that of Labour's Q1. The Lib Dems will struggle to increase their representation here, whilst Plaid may be hopeful of stealing one or two seats from Labour.
How to our predictions compare?
Of course, we're not saying that our predictions are going to be spot on - 2015 proved that. So we are going to look at predictions made elsewhere in order to see whether we are significantly away from the consensus.
For our own predictions, we are going to use the Q2 scores from above.
Party |
TGIAF |
||||
CON |
374 |
358 |
302 |
375 |
357 |
LAB |
193 |
218 |
269 |
202 |
222 |
SNP |
46 |
49 |
44 |
48 |
45 |
LIB |
14 |
3 |
12 |
2 |
4 |
PLA |
4 |
3 |
2 |
3 |
1 |
GRE |
1 |
1 |
1 |
1 |
O |
UKIP |
O |
O |
O |
O |
O |
This throws up some interesting results. Notably, our prediction for Labour is significantly below all the other predictions we've looked at, whilst our Conservative prediction is at the higher-end of the range.
For the Lib Dems, who (as we mentioned above) could have been expecting around 20 seats before, to see predictions as low as 2 will be a complete shock. Let's hope Paddy Ashdown isn't on the TV coverage tonight...
Personally, I am suspicious about Ashcroft's numbers, as his figures for the minor parties appear unlikely - no-one else has the Greens or Plaid losing seats - which makes me think he used a broad brush for some of his results. However, his majority size is roughly in line with everyone else's, so I am less suspicious about that.
The YouGov numbers, which for Labour and the Conservatives are wildly different to the rest, are based on an experimental and controversial new methodology. However, they say that it predicted the results of the main 2016 votes (Brexit and US) with good accuracy, so that is one to pay attention to.
Summary
Our final results are in, and despite a recent Labour "surge", and a definite improvement in the polls, the reaction by the bookies has been a reluctant one, largely sticking with their odds suggesting a huge Conservative landslide.
The one saving grace for Labour, in terms of this model, is that I have my concerns over how slow the bookmakers are to polling evidence. In 2015 polls initially had Labour in the lead, with the Lib Dems reasonably high, but both eroded away as the Conservatives grew. Whilst the model we built did move in those directions, it failed to swing enough to predict the final results. So, for example whilst the model slowly increased its prediction for the Conservatives, it never got close to predicting the majority they achieved. This means that there is a chance they might be similarly slow on the uptake, and have in fact underestimated Labour's bounce.
However, this year's election is an incredibly hard one for pollsters and prediction-makers, as there are numerous factors to take into account. The notorious one which was a key factor in 2015 was the "shy Tory" effect, and how the polls have adapted to that will have a huge influence on whether they got their numbers correct.
And, finally, another reminder that our coverage tonight can be found on this page. It's sure to be a hectic night!
Appendix - the TGIAF Election Dossier
| tgiafdossier2017.pdf |
The file here will provide an invaluable guide if you are planning to stay up all night to follow the election.
It contains a summary of the results presented here, as well as a seat-by-seat guide. For each seat you will find our predicted chances for the top three parties, as well as a list of which ones are the closest marginals, who the notable candidates are and what time the results can be expected.
It contains a summary of the results presented here, as well as a seat-by-seat guide. For each seat you will find our predicted chances for the top three parties, as well as a list of which ones are the closest marginals, who the notable candidates are and what time the results can be expected.
 RSS Feed