by Dr Adrian Worton
Apparently, we now have General Elections every two years. The frequency of these things means that I never have the time to update our model. However, I am currently off work following recent parenthood, so I do have a chance to at least see how everything in shaping up.
Apparently, we now have General Elections every two years. The frequency of these things means that I never have the time to update our model. However, I am currently off work following recent parenthood, so I do have a chance to at least see how everything in shaping up.
Some election predictions use a system where they simply predict the winner in each seat. This is okay, but this wouldn't distinguish between (for example) Dundee East and North East Fife. Both of these seats were won by the SNP, but with majorities of 6,645 and 2 respectively, therefore it is fair to say one is much more 'safe' than the other. When it comes to a new election, including probabilities (rather than simple predictions) allows much more analysis.
That is what we aim for with our General Election model. However, we infer our probabilities by using bookmakers' odds, and a curious thing has happened with their odds this year:
That is what we aim for with our General Election model. However, we infer our probabilities by using bookmakers' odds, and a curious thing has happened with their odds this year:
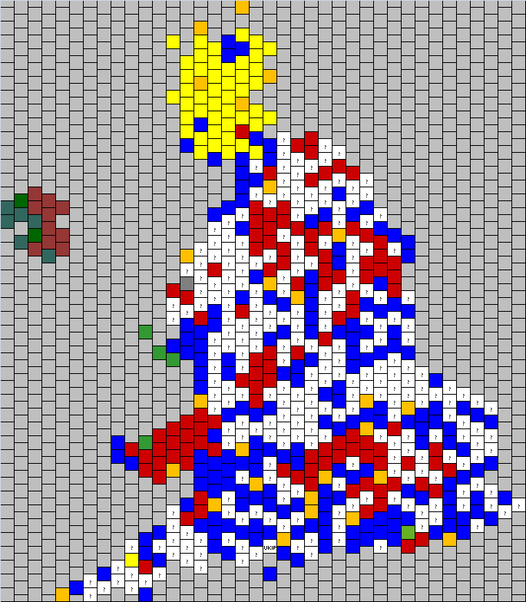
Those white cells are ones with no results, and there are only odds for 392 seats (of 650). This means we can't currently get a full model up and running yet. We are getting the model ready for when they are. This involves adding in new parties, which has lead to some... unexpected results...
Today, we are going to analyse the seats that are available. We can compare them to their odds in 2017, and even try and extrapolate across the remaining seats to give a tentative overall prediction.
Methodology
For regular readers of this website, the method used to calculate probabilities based on odds is not new, as it forms the foundation of all our other models. So we won't go over again, as the methodology is explained in the introduction to our 2017 General Election coverage.
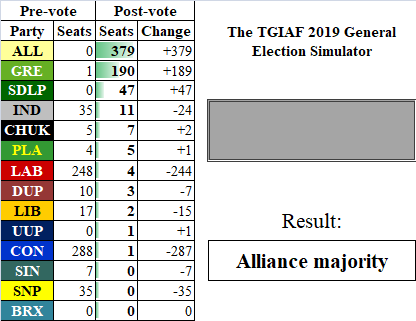
This year's model (great album) has the most parties of any TGIAF election model. Added in are the newcomers Change UK and the Brexit Party, whilst Alliance are included as they appear more likely to challenge for a seat compared to 2017. Meanwhile, UKIP have been removed to reflect their catastrophic decline in the polls. As always, 'Independent' covers not only independent candidates, but also any party which isn't included within the model.
Our measurement of a party's standing is taken by summing their likelihood of victory across all seats.
Partial results
First of all, we can see how the parties in the model shape up across the 392 seats we do data for. To do in isolation would be foolish, since the selection of seats may be disproportionately in areas that suit one party or another. Therefore, we have also included our corresponding predictions for the same seats in 2017, and how many seats each party holds from the selection shown.
Methodology
For regular readers of this website, the method used to calculate probabilities based on odds is not new, as it forms the foundation of all our other models. So we won't go over again, as the methodology is explained in the introduction to our 2017 General Election coverage.
This year's model (great album) has the most parties of any TGIAF election model. Added in are the newcomers Change UK and the Brexit Party, whilst Alliance are included as they appear more likely to challenge for a seat compared to 2017. Meanwhile, UKIP have been removed to reflect their catastrophic decline in the polls. As always, 'Independent' covers not only independent candidates, but also any party which isn't included within the model.
Our measurement of a party's standing is taken by summing their likelihood of victory across all seats.
Partial results
First of all, we can see how the parties in the model shape up across the 392 seats we do data for. To do in isolation would be foolish, since the selection of seats may be disproportionately in areas that suit one party or another. Therefore, we have also included our corresponding predictions for the same seats in 2017, and how many seats each party holds from the selection shown.
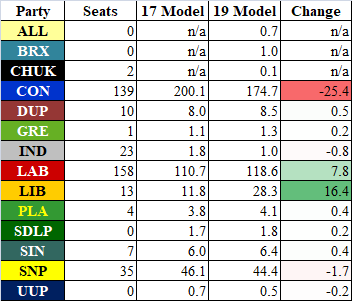
Focusing on the main battle between the Britain-wide parties (as opposed to regional ones such as the SNP and DUP), it seems like there's a shift away from the Conservatives (down 25.4 seats from the 2017 model) and towards the Liberal Democrats and Labour (up 16.4 and 7.8 respectively).
However, whilst the Conservatives are doing worse in the new model compared to the 2017 model, this would still represent a big increase in seats; they would gain 36 of the 392 subset, which would be enough to each a majority assuming they didn't lose seats in the remaining 258.
So, ultimately our model is predicting the Conservatives to do worse than in it predicted in 2017, but this would still represent a strong victory. This is consistent with current polling; polls ahead of the 2017 election had Theresa May on course for a landslide victory, only for the final results to shock (nearly) everyone. Currently polls indicate they may earn a healthy majority, albeit one less than that predicted two years prior.
The opposite is generally true for Labour. There is also an 'Independent effect', as the Conservatives and Labour regain seats currently held by independent MPs (either through resignation or by having the whip removed).
Nationwide predictions
Our model includes a 'swing' parameter, allowing us to modify the strength of each party within the model.
We can alter these values in the 2017 model to make the probabilities for the 392 seat sample match the 2019 probabilities, and from there get a tentative nationwide prediction for the parties in our model. Doing so gives us the results shown below. The second column shows the seats currently held, the third column shows our model's predictions.
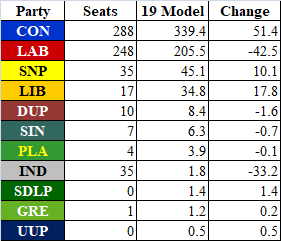
Alliance, Brexit Party and Change UK are left out as they weren't a part of the 2017 model.
Here we see a Conservative majority of approximately 28, although this would be larger in practice when factoring in the Speaker and Sinn Féin. They would also be bolstered by the 8 or so DUP MPs, and potentially one or two Brexit Party MPs. Their increase mirrors a big decrease in Labour MPs, whilst the SNP and Lib Dems both see healthy increases.
As mentioned above, this matches current polling, although this majority is slightly narrower than that predicted elsewhere. With the deadline for nominations due soon, it will be interesting to see whether parties pulling candidates will have an effect on the odds.
Summary
To reiterate, the nationwide predictions are very tentative, as we don't have odds for these seats. However, it does give us an idea of where the parties are compared to last time round.
Supporters of Labour can point to the fact that the party is doing better than they were in the 2017 polls/odds. They confounded those polls and denied May a majority. However, it is likely that pollsters/bookies have learned from this, and a similar outcome feels unlikely (but not impossible).
There's a month to go before the election, and once we have the full odds available we will start providing daily updates on the expected seat totals for each party. We'll have analysis along the way, although circumstances means that it's unlikely we'll be able to do election night coverage as in previous years.
 RSS Feed