
by Adrian Worton
It's easy to criticise the First Past the Post method - we should know, that's what we did in our last article, where we showed that the UK has the second-worse electoral system in the EU in terms of having results which represent the will of the people.
The challenge is to present alternatives. Therefore, we will be looking at the D'Hondt method today, a proportional system used in many European nations. Having obtained the voting statistics for the recent election, we can use these to see how this method would have changed the results.
How does the D'Hondt method work?
This will not be an extensive overview, as plenty of explanations appear elsewhere.
For each region, you will have a certain number of seats you need to allocate (s), and a total number of votes for a variety of parties. You then divide each party total by 1, 2, etc, all the way up to s. You then look at the resulting values, and pick the s-highest values.
It will be better illustrated by using an example. Say we combine all four Cardiff constituencies into one which will allocate four seats. We therefore take each party's total, and divide them by 1, 2, 3 and 4. You can see the results of this below:
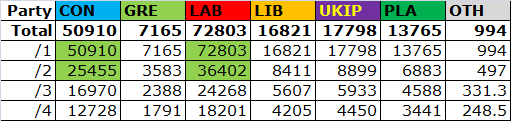
We now simply choose the four highest values. These happen to be two Conservative, and two Labour. Under First Past the Post, Labour took three of the Cardiff seats, and the Conservatives just one, so we can already start to see some change.
What size constituencies will we look at?
For this study, we are going to assume that the current number of 650 MPs will be kept. Therefore, if we join up 10 FPTP constituencies into one D'Hondt constituency, it will be one which allocates 10 seats.
We will find that as the number of seats we are allocating in each constituency becomes larger and larger, the closer the results will be to exactly reflecting the percentage of votes each party obtained. Therefore, in the interests of having a low "Mean error" (a term we used in our previous article, where a lower value means the results are closer to the votes cast), larger constituencies are preferable.
On the other hand, a key defence of FPTP is that members of the public have a local MP they can hold to task. This wouldn't immediately be lost under D'Hondt, as constituencies which only allocate a handful of MPs would mean that members of the public would have a few MPs they could communicate with, without dramatically increasing the distance they are away from an MP. However, once we get to the stage of having constituencies the size of those used in the European Elections, then it becomes harder for people to know which MPs they can contact. So in terms of having a direct relationship between voters and MPs, smaller constituencies are preferable.
Therefore, we are looking for a size which doesn't eliminate the idea that an MP represents an area, but is still large enough to introduce a sufficient degree of proportionality. We will look at the following seven ways of splitting the country:
We will compare these with the actual results. It should be noted that FPTP constituencies are equivalent to D'Hondt constituencies where only one seat is to be allocated.
In order to see the groups your own constituency falls into, and its results under D'Hondt, see the Appendix at the end of this article.
The results
We will split the results by the countries of the UK, given each one has a very different political climate. You can see the results on the slideshow below - use the arrow keys to cycle between images.
What size constituencies will we look at?
For this study, we are going to assume that the current number of 650 MPs will be kept. Therefore, if we join up 10 FPTP constituencies into one D'Hondt constituency, it will be one which allocates 10 seats.
We will find that as the number of seats we are allocating in each constituency becomes larger and larger, the closer the results will be to exactly reflecting the percentage of votes each party obtained. Therefore, in the interests of having a low "Mean error" (a term we used in our previous article, where a lower value means the results are closer to the votes cast), larger constituencies are preferable.
On the other hand, a key defence of FPTP is that members of the public have a local MP they can hold to task. This wouldn't immediately be lost under D'Hondt, as constituencies which only allocate a handful of MPs would mean that members of the public would have a few MPs they could communicate with, without dramatically increasing the distance they are away from an MP. However, once we get to the stage of having constituencies the size of those used in the European Elections, then it becomes harder for people to know which MPs they can contact. So in terms of having a direct relationship between voters and MPs, smaller constituencies are preferable.
Therefore, we are looking for a size which doesn't eliminate the idea that an MP represents an area, but is still large enough to introduce a sufficient degree of proportionality. We will look at the following seven ways of splitting the country:
- Split 1: current constituencies are merged into 177 groups of 3-5.
- Split 2: 74 groups of 6-13.
- Split 3: 32 groups of 15-28. Northern Ireland becomes one constituency.
- Split 4: England and Scotland are split into 16 groups of 29-49. Wales becomes one constituency.
- Split 5: England is split into 7 groups of 65-84. Scotland becomes one constituency.
- Split 6: England is split into 3 groups of 140-235.
- Split 7: 4 constituencies - England, Northern Ireland, Scotland and Wales.
We will compare these with the actual results. It should be noted that FPTP constituencies are equivalent to D'Hondt constituencies where only one seat is to be allocated.
In order to see the groups your own constituency falls into, and its results under D'Hondt, see the Appendix at the end of this article.
The results
We will split the results by the countries of the UK, given each one has a very different political climate. You can see the results on the slideshow below - use the arrow keys to cycle between images.
It is no big surprise to see that the parties who were noted as having lost out through FPTP - UKIP, the Greens and the Lib Dems - all see their seat share grow as the constituencies become larger. Meanwhile, those who had overachieved under the current system - the Conservatives, Labour and the SNP - see their seats drop.
However, the exact nature of the results are academic, as an election conducted under a proportional system would see markedly different voting patterns. In particular, parties which rely on tactical voting to bully votes from other parties would lose out even more. What we are now interested in is how well each set of results reflect the votes cast by the public. So for each split, we work out the mean error value for each of the four nations. These are shown below:
However, the exact nature of the results are academic, as an election conducted under a proportional system would see markedly different voting patterns. In particular, parties which rely on tactical voting to bully votes from other parties would lose out even more. What we are now interested in is how well each set of results reflect the votes cast by the public. So for each split, we work out the mean error value for each of the four nations. These are shown below:
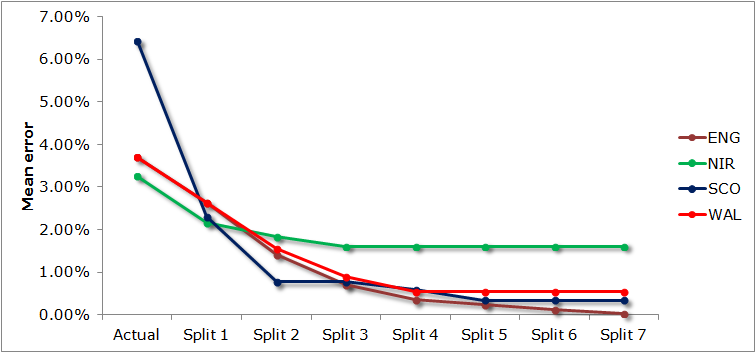
We see that indeed the mean error is continually reduced by larger constituency sizes. And this is reflected by the scores for Split 7 - we see that the scores for each country are inversely proportional to the number of constituencies in that nation. These final values are the best possible, unless the number of MPs is increased.
For Northern Ireland, we see that just one split is necessary to get the mean error at a level very close to the best possible, and just two splits are needed in Scotland. England and Wales see a a slightly slower decline. Although even there, by Split 2 we see that the mean error is below 2%, which is in line with most European nations, and by a third split we see the value drop to below 1%.
Conclusion
These results show that even only introducing slightly larger constituencies is enough to dramatically reduce the injustices we see under the current FPTP system. A good compromise between the two competing factors we earlier identified is Split 2, where between 6-13 constituencies are combined.
Of course, the sizes of constituencies need not be the same across the country. For rural areas, where a larger constituency would dramatically increase the distance the public could be from their MPs' offices, small groups of around 3-5 constituencies may be preferable. And in Northern Ireland, Wales and Scotland, their lower number of seats means that merging too many constituencies could result in a lack of regional identity, therefore once again, smaller splits could be the solution.
What is evidently clear though, is that the current system in the UK appears to promote the highest possible level of discord between voters and their elected representatives, and that solutions are there.
Appendix - D'Hondt results
Use the drop-down list in the grey cell below to pick a particular constituency. Below will be the names of each of the constituencies it ends up in after each split, and the results for that constituency.
Use the drop-down list in the grey cell below to pick a particular constituency. Below will be the names of each of the constituencies it ends up in after each split, and the results for that constituency.
 RSS Feed